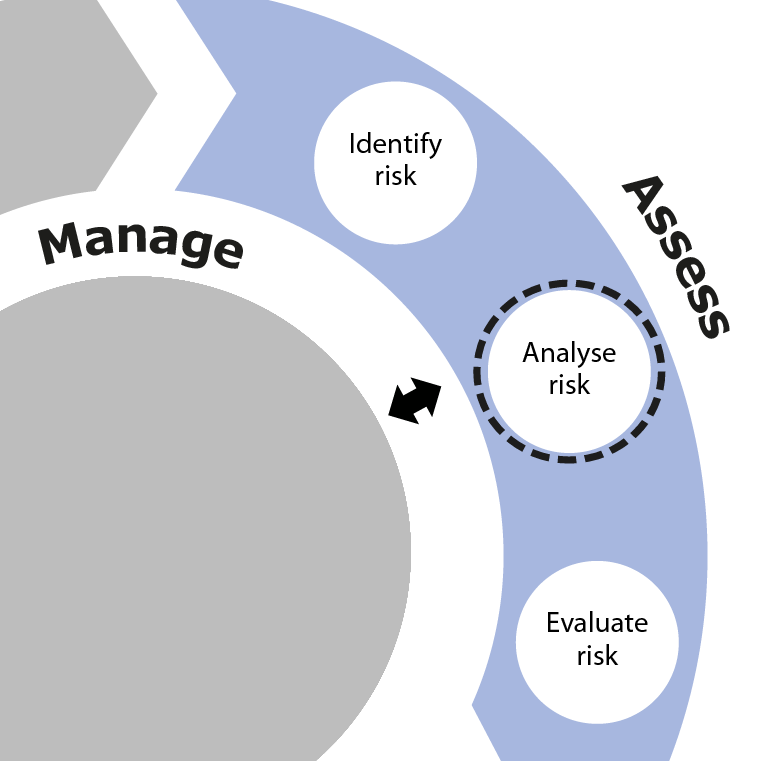
Analyse risk
Determining the severity of each risk in terms of impact and likelihood
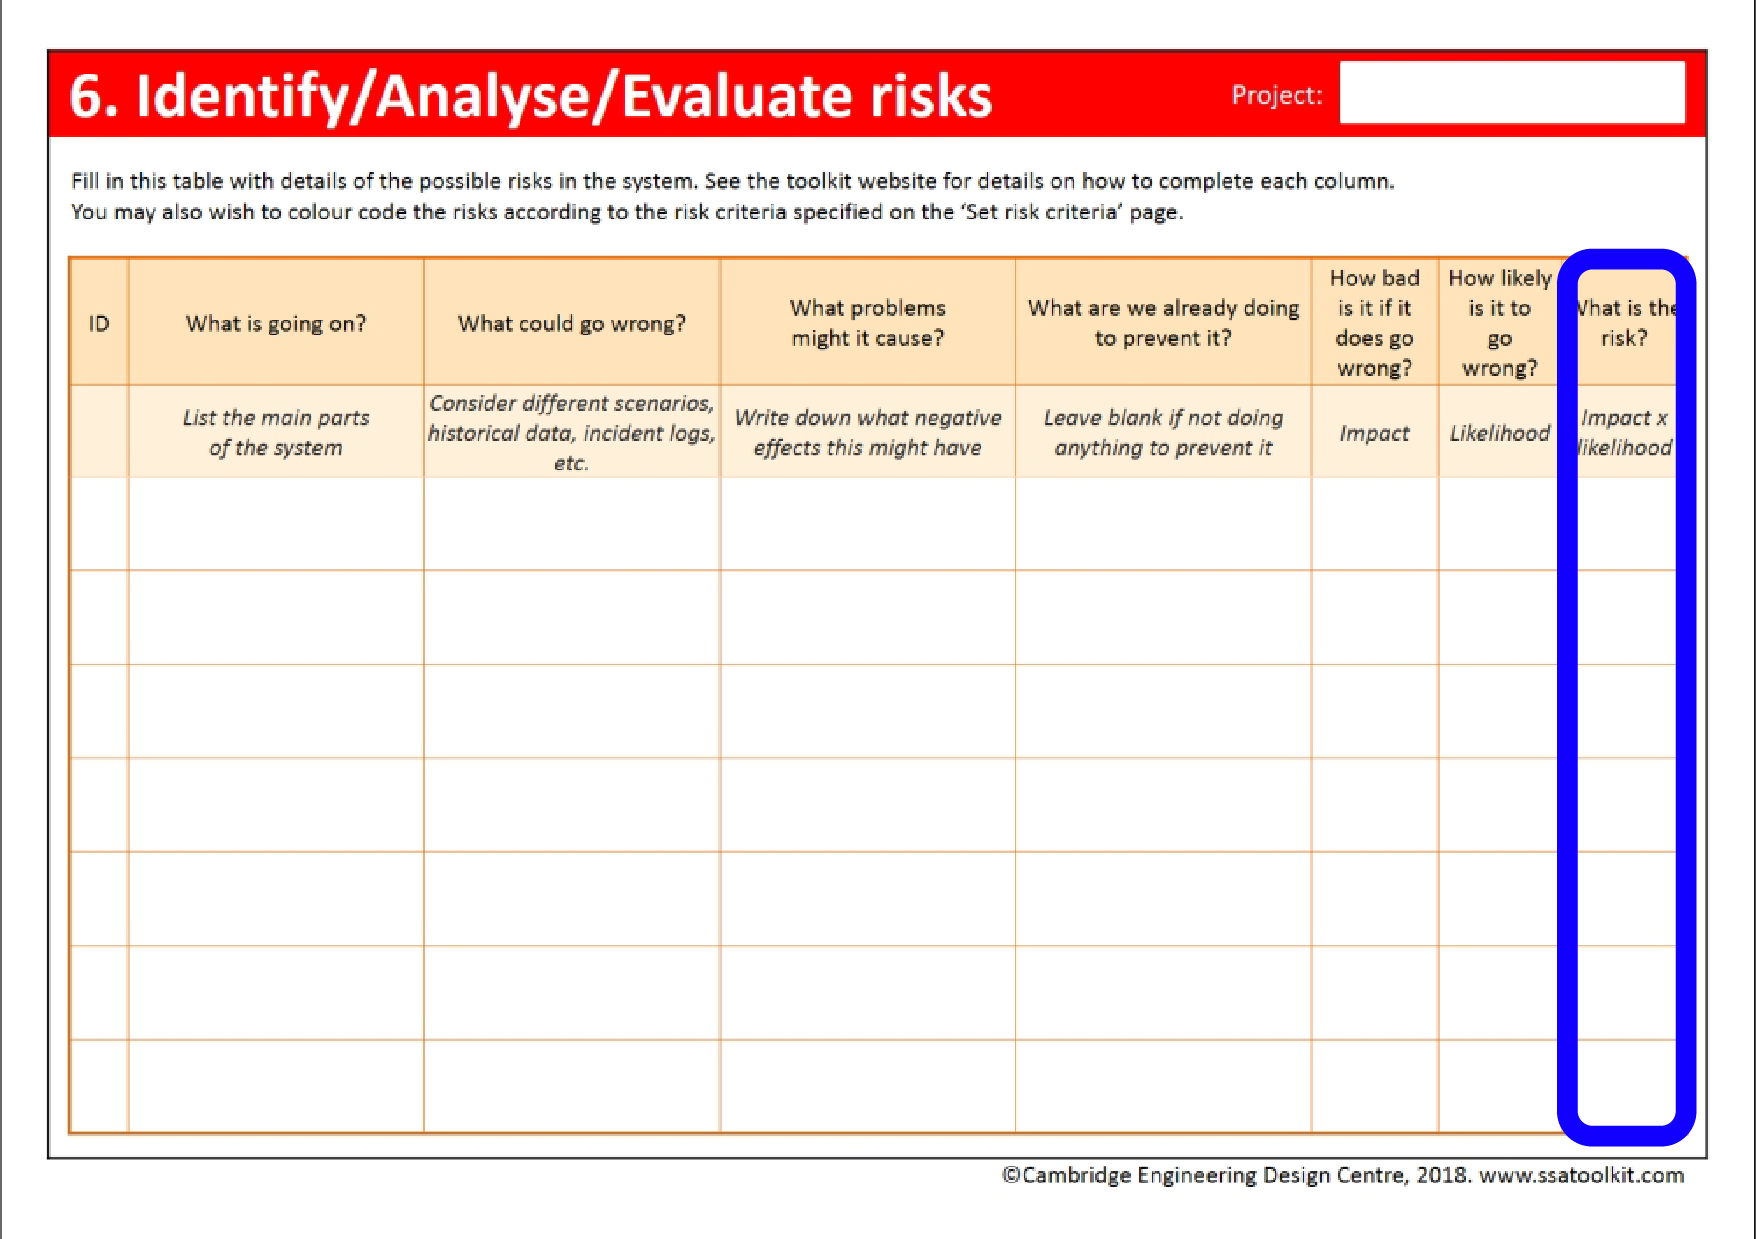
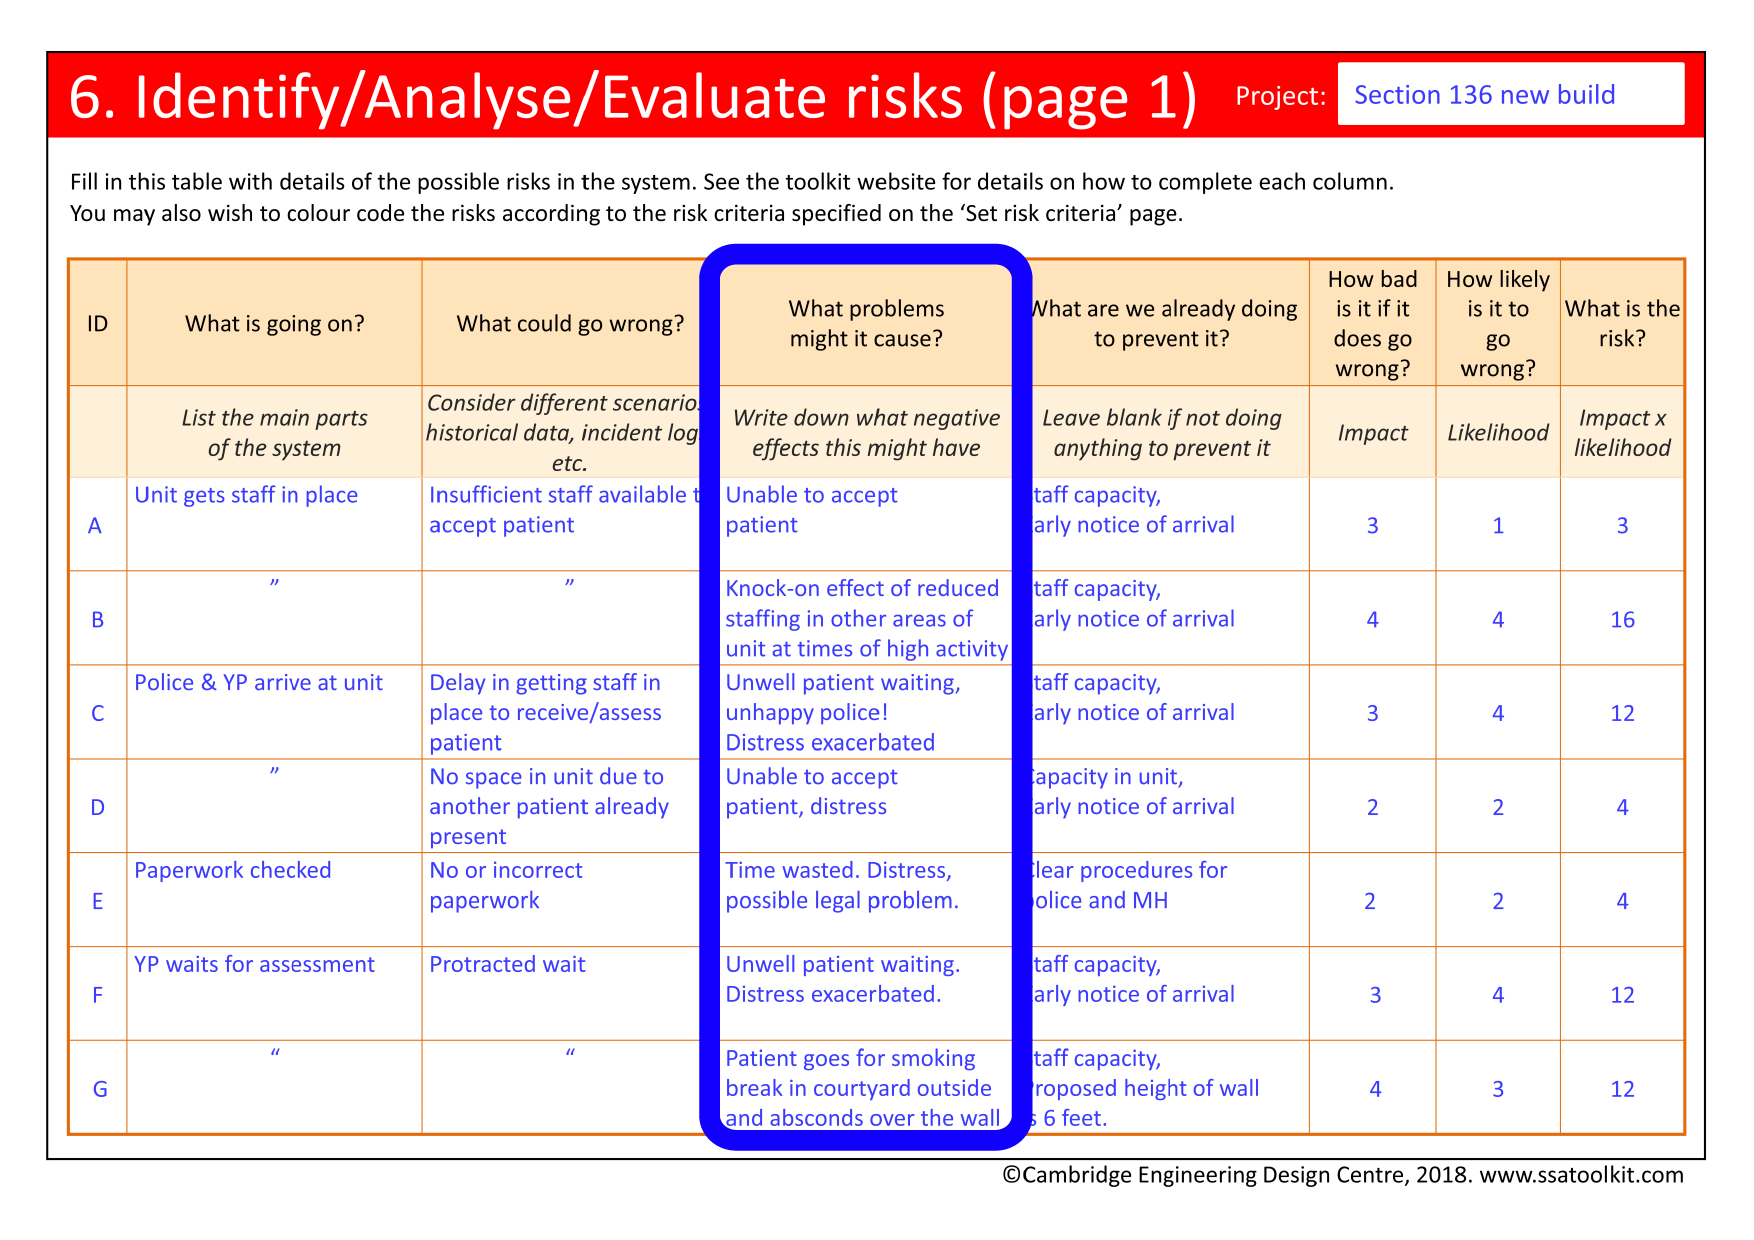
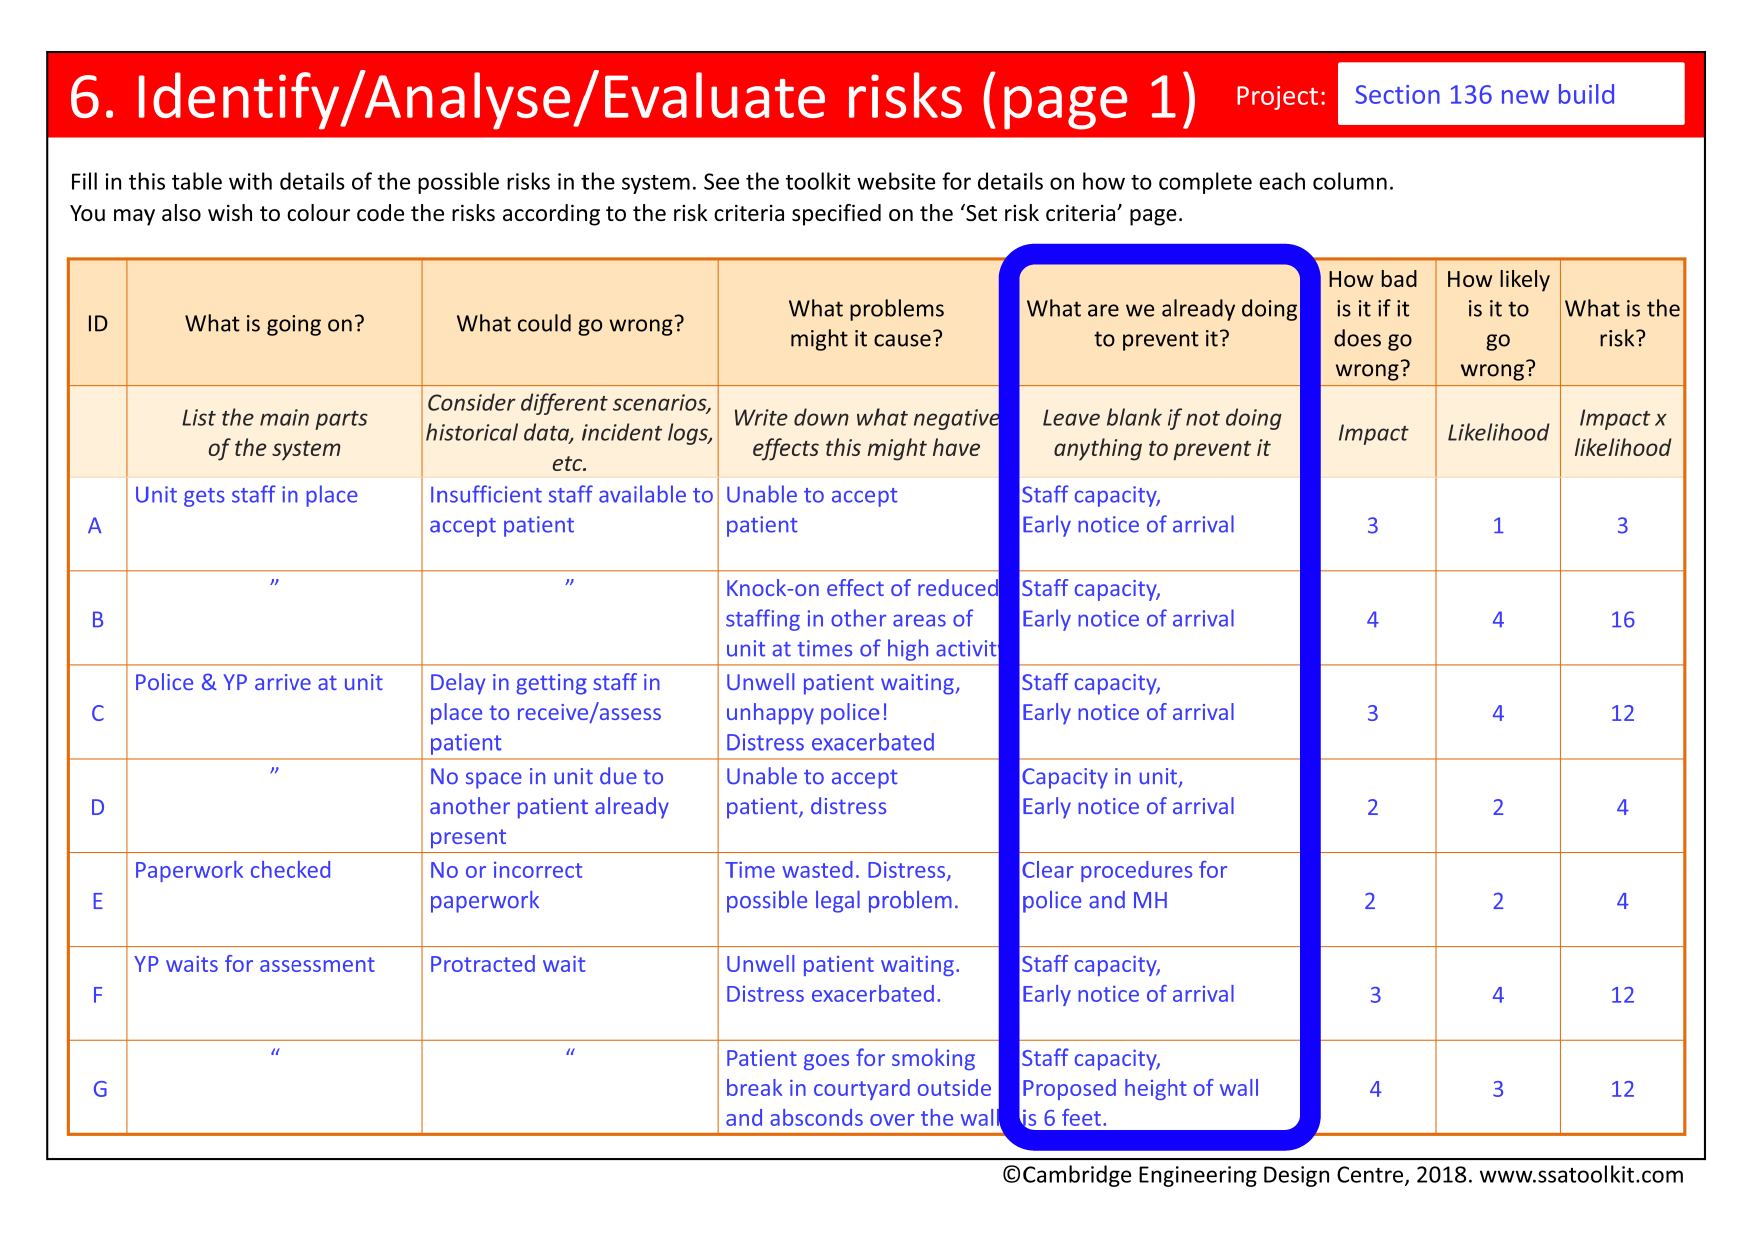
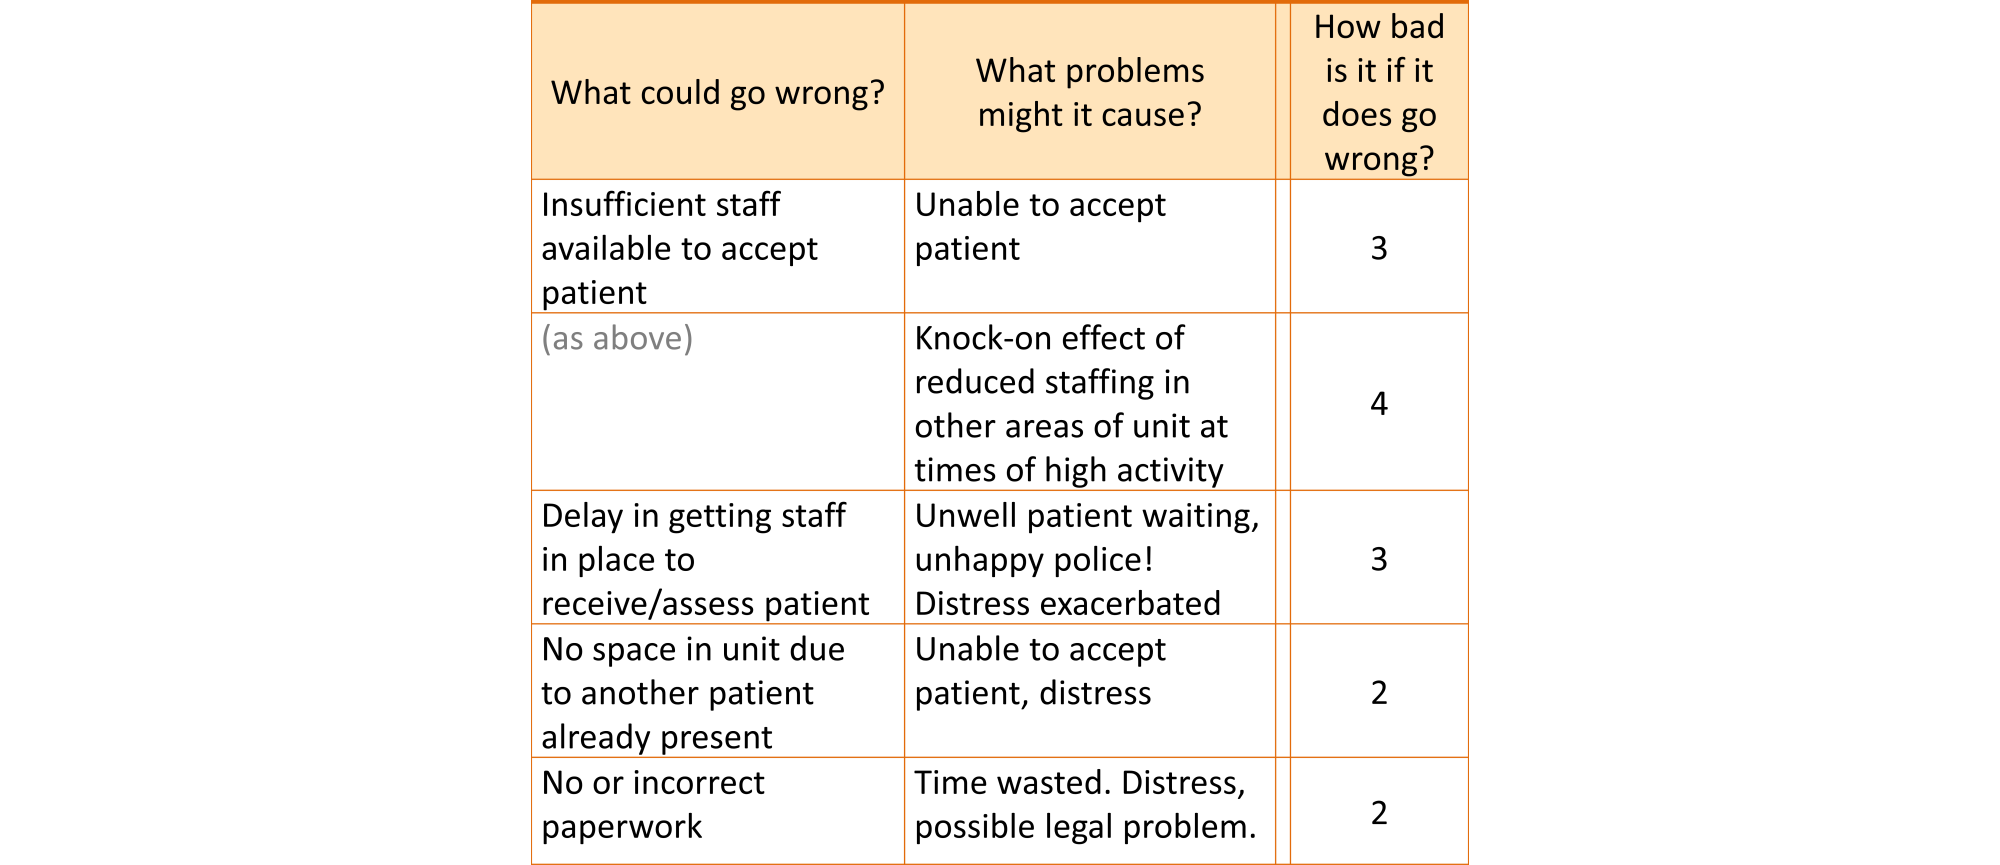
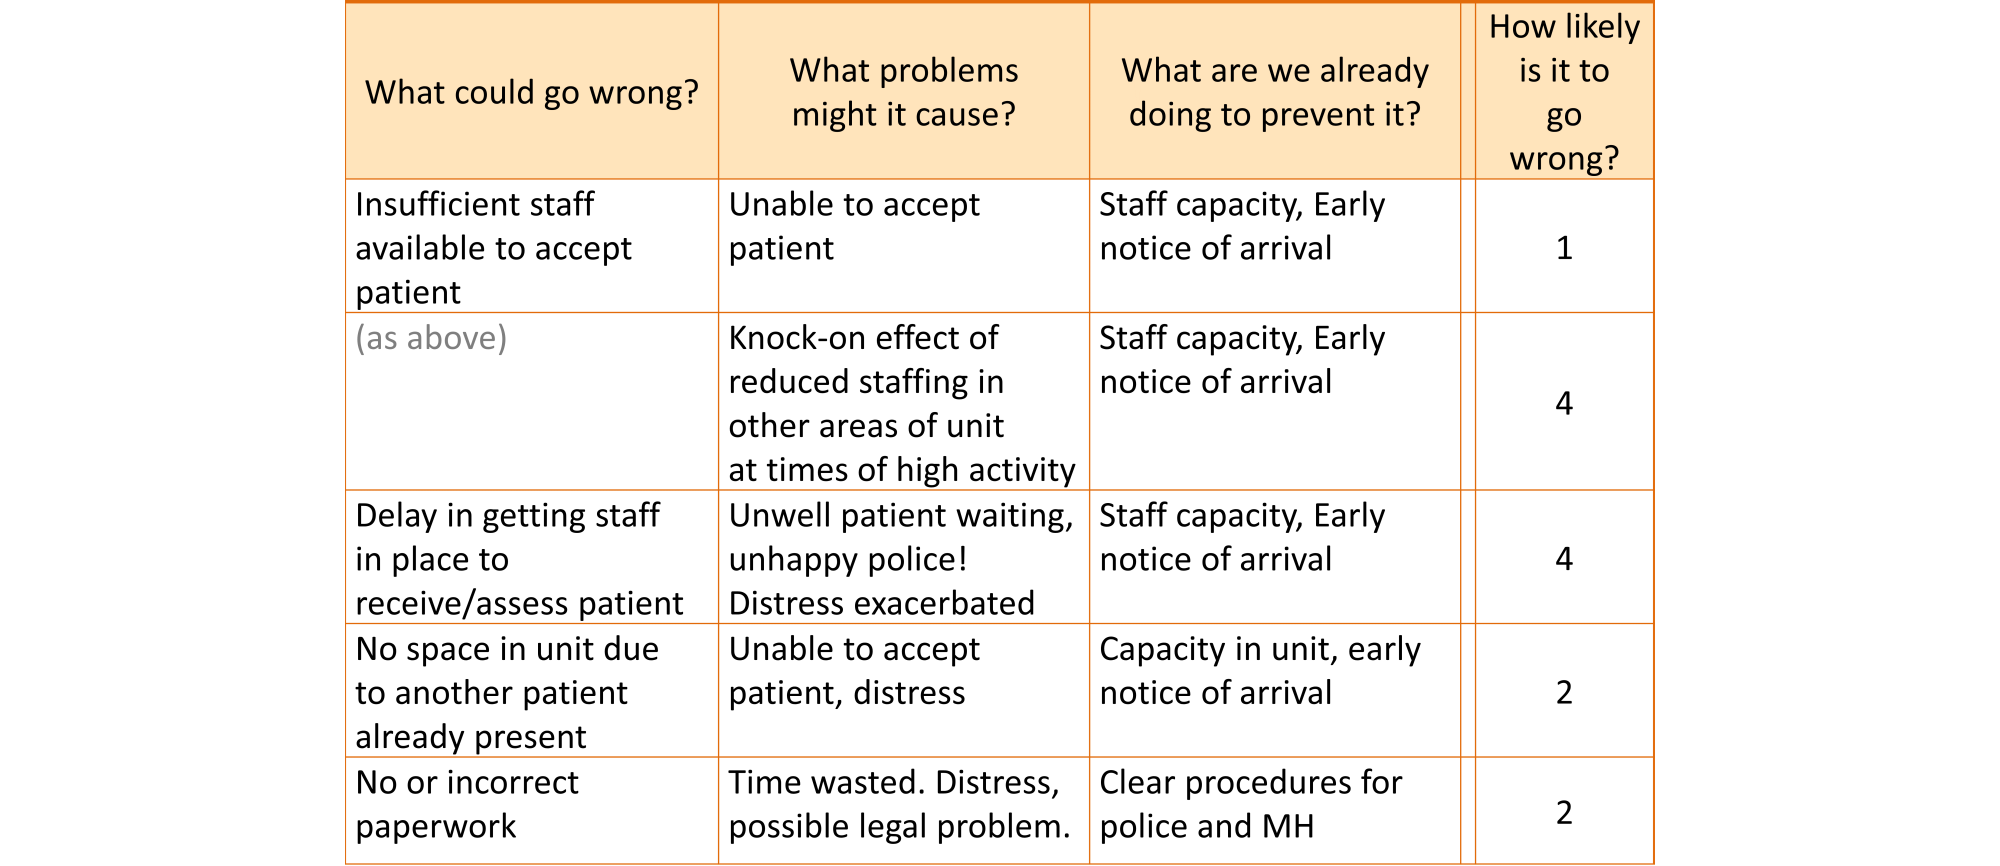
What problems might it cause?
It is important to identify not only what might go wrong in the system, but what the outcomes of that might be: what resultant problems it might cause. There are many types of outcome that may need to be considered in the SSA, including, in particular, injury to patients, staff or the public. Other types, which are sometimes referred to as risk ‘domains’, may include outcomes relating to:
- Quality of service;
- User experience;
- Complaints or litigation;
- Project performance, for example, excessive delays;
- Financial performance, for example, a failure to meet a CQUIN target;
- Inspection or audit targets, for example, a loss of accreditation or an increase in inspections;
- Publicity for the Trust, for example, damage to reputation;
- The environment.
It is seldom practical to consider all of these in one SSA. The scope of the investigations (as specified in the Outline goals activity) should identify the most relevant type or types of outcomes to be investigated. Some SSAs may focus on just one type of risk. However, there is then the danger of ignoring or even increasing risks of other types, some of which may be very high. It may be necessary to adjust the scope of the SSA if it is felt that important issues are being omitted. Introducing more risk types increases the complexity of the assessment and the time required to complete it, but also its rigour.
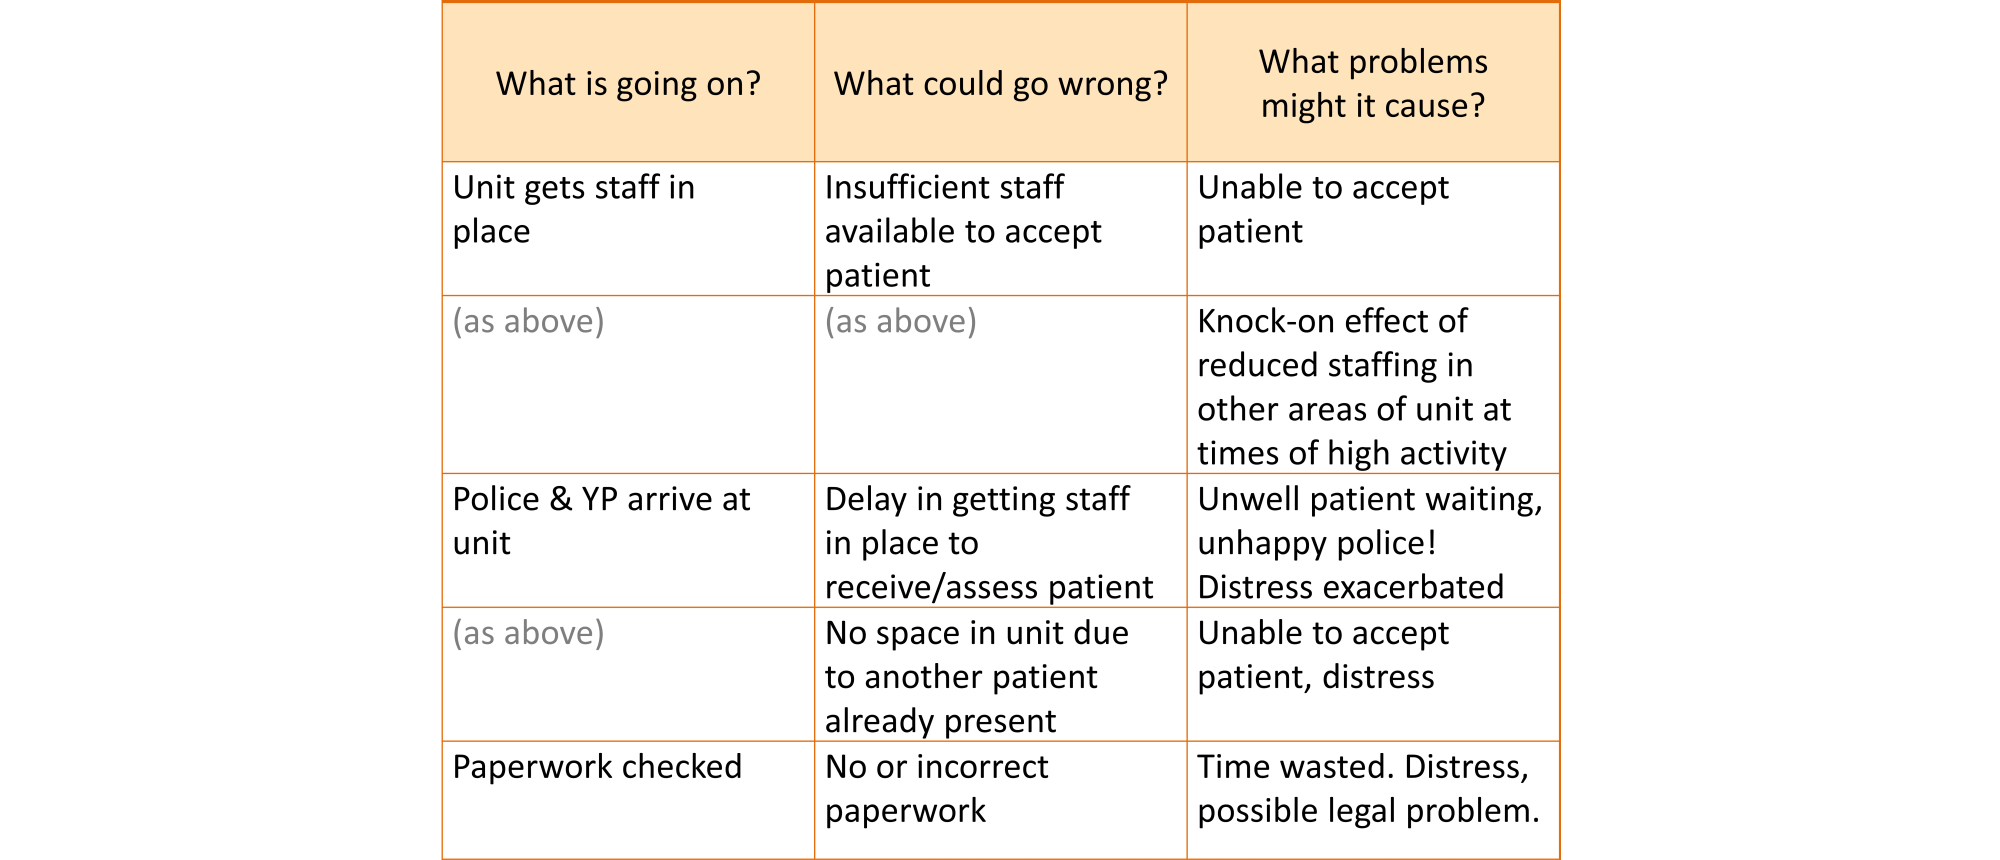
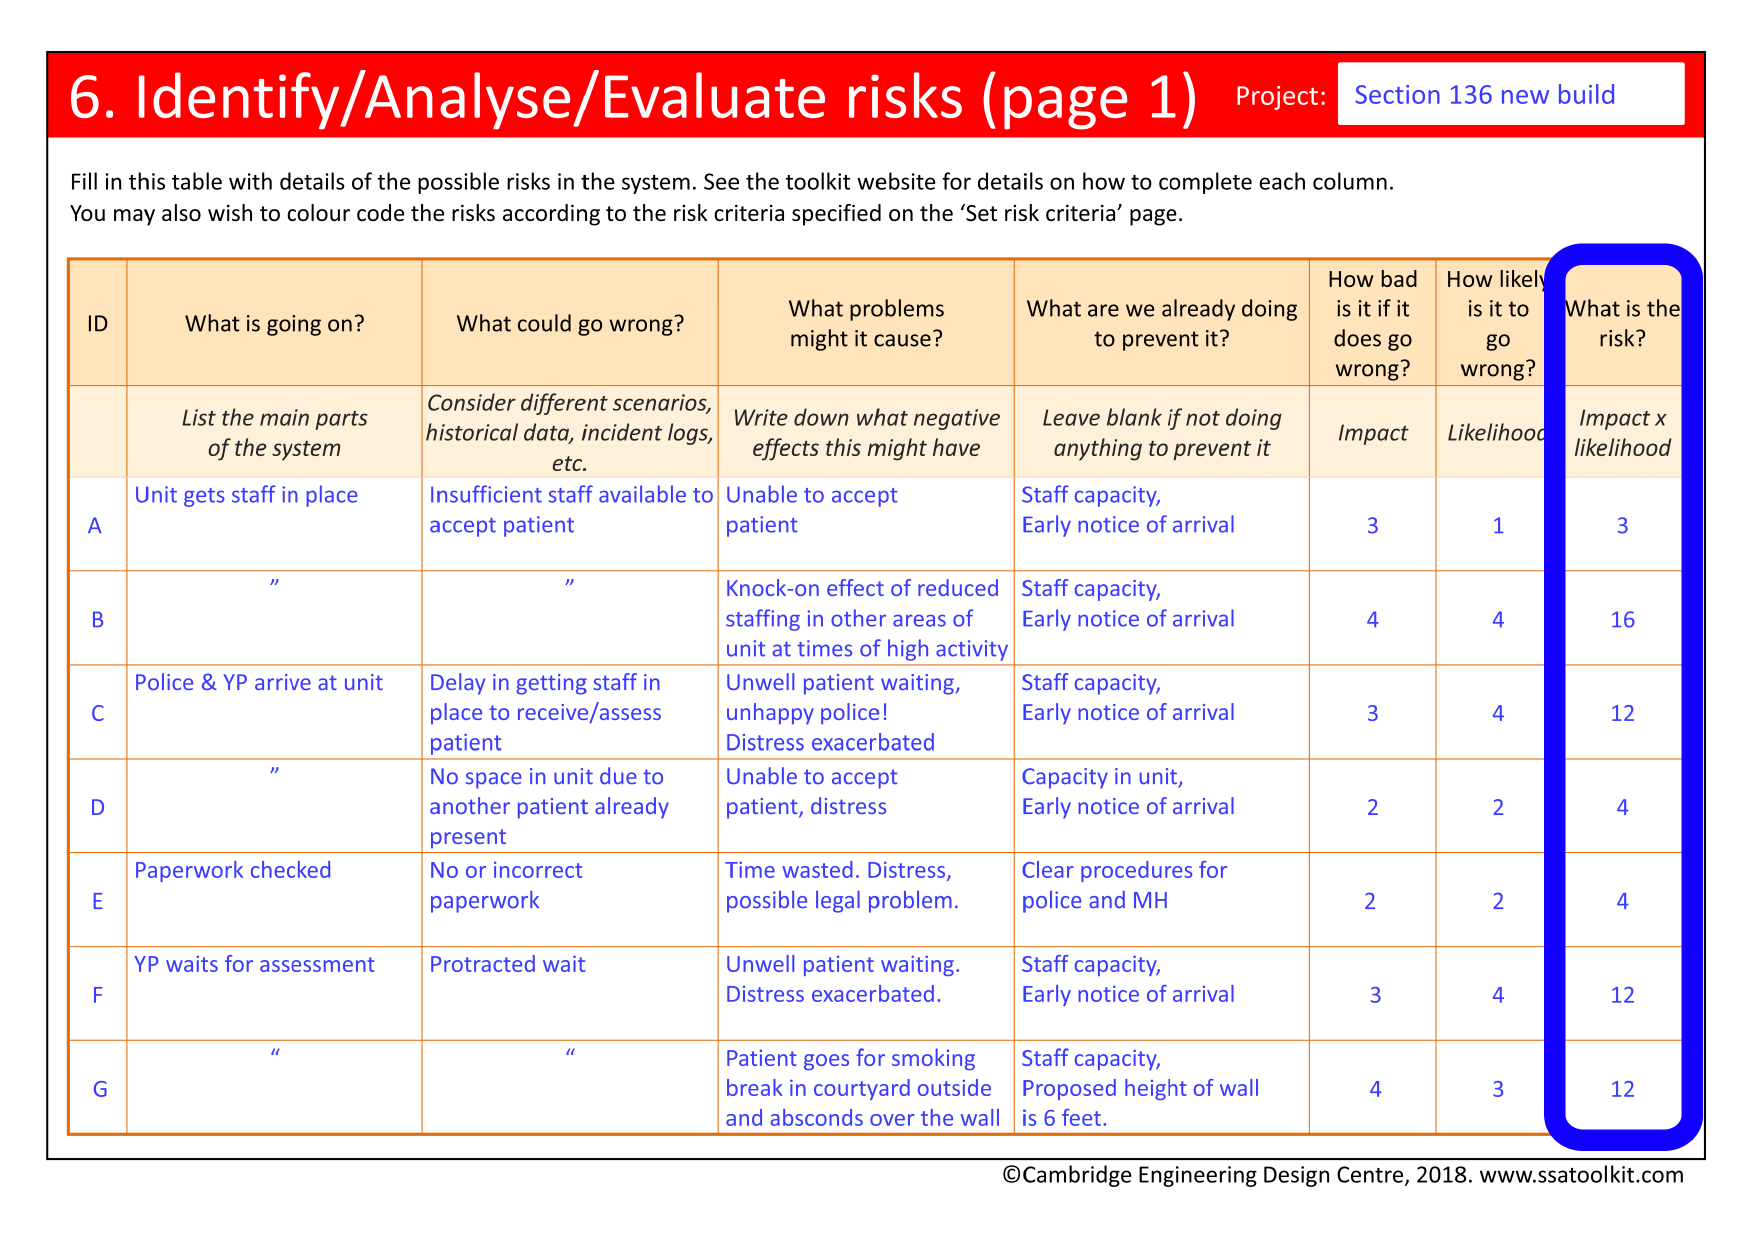
Examples of problems that might be caused by things in the system going wrong
Putting ‘What problems might it cause’ into practice |
|
|---|---|
|
|
|
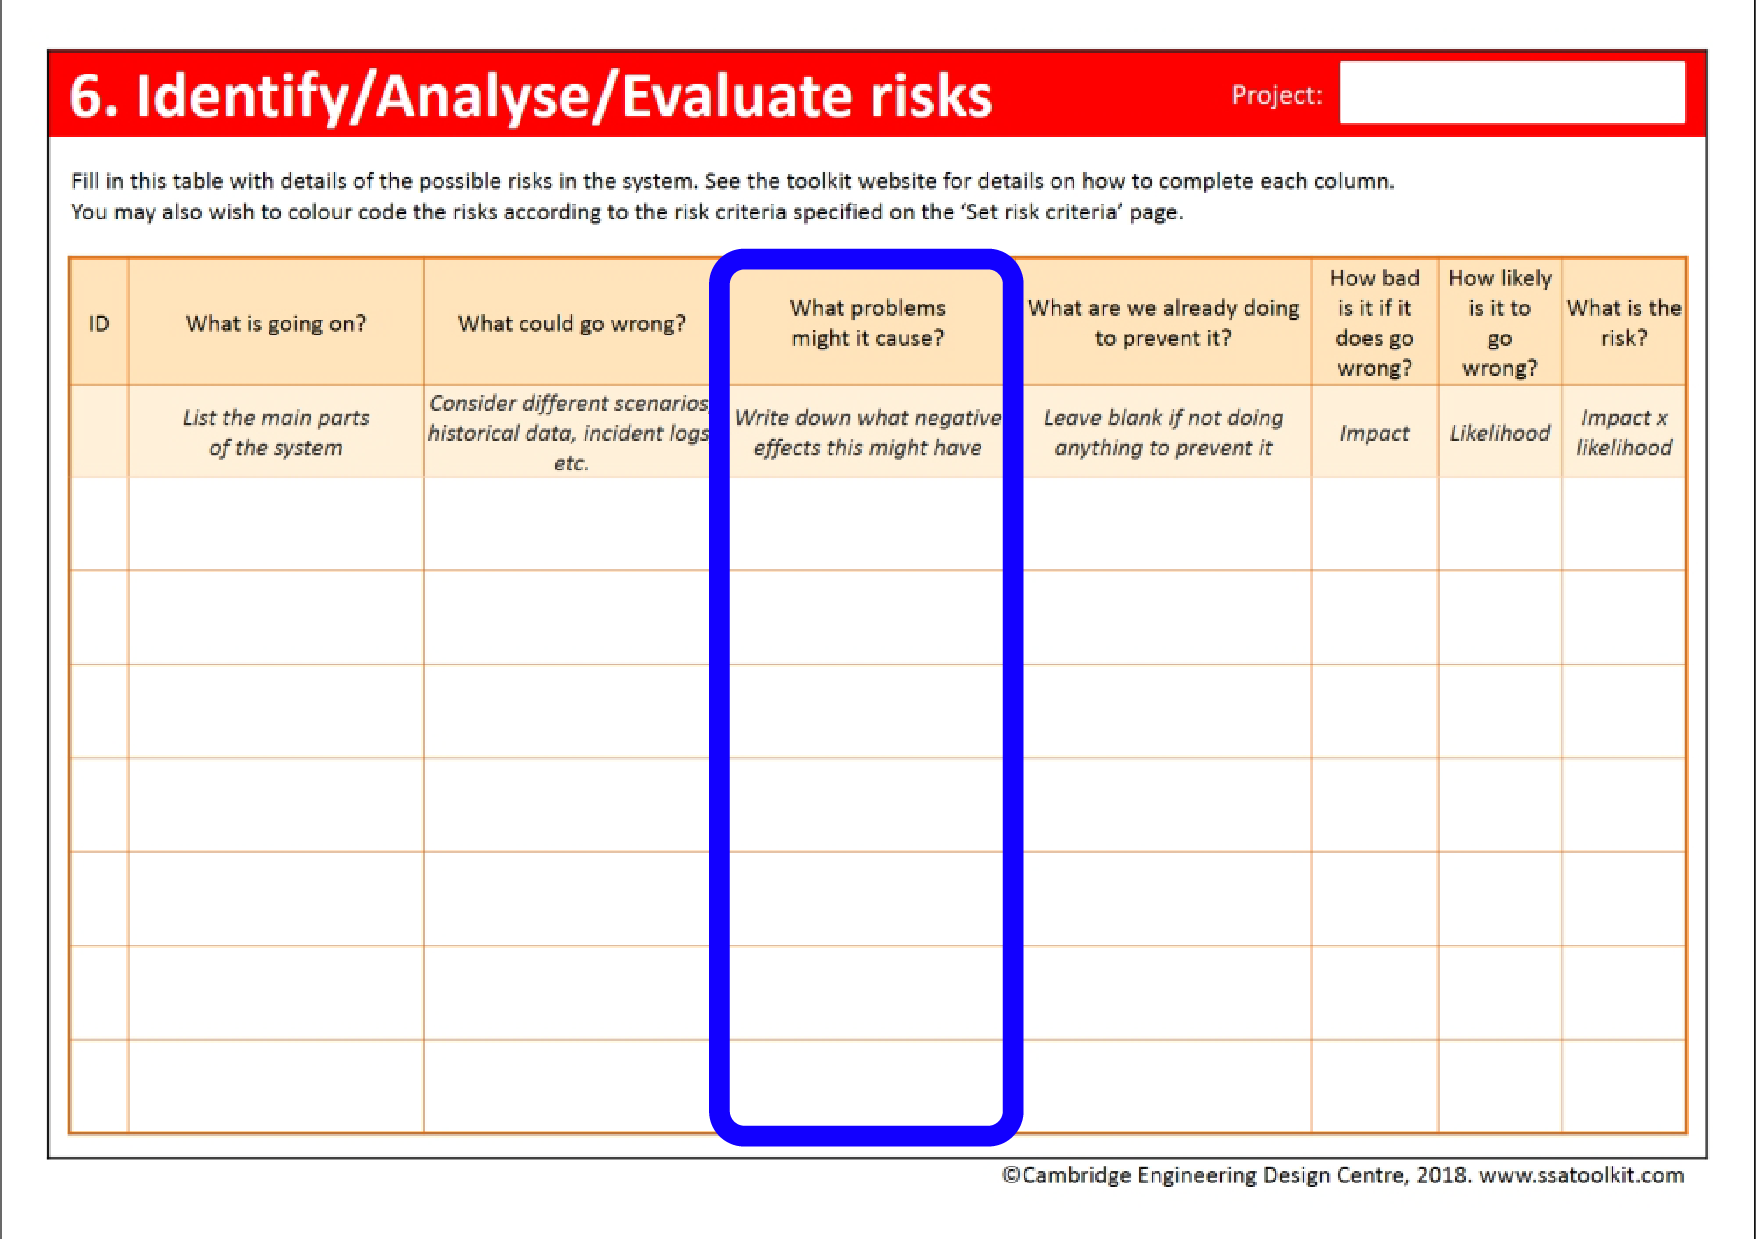
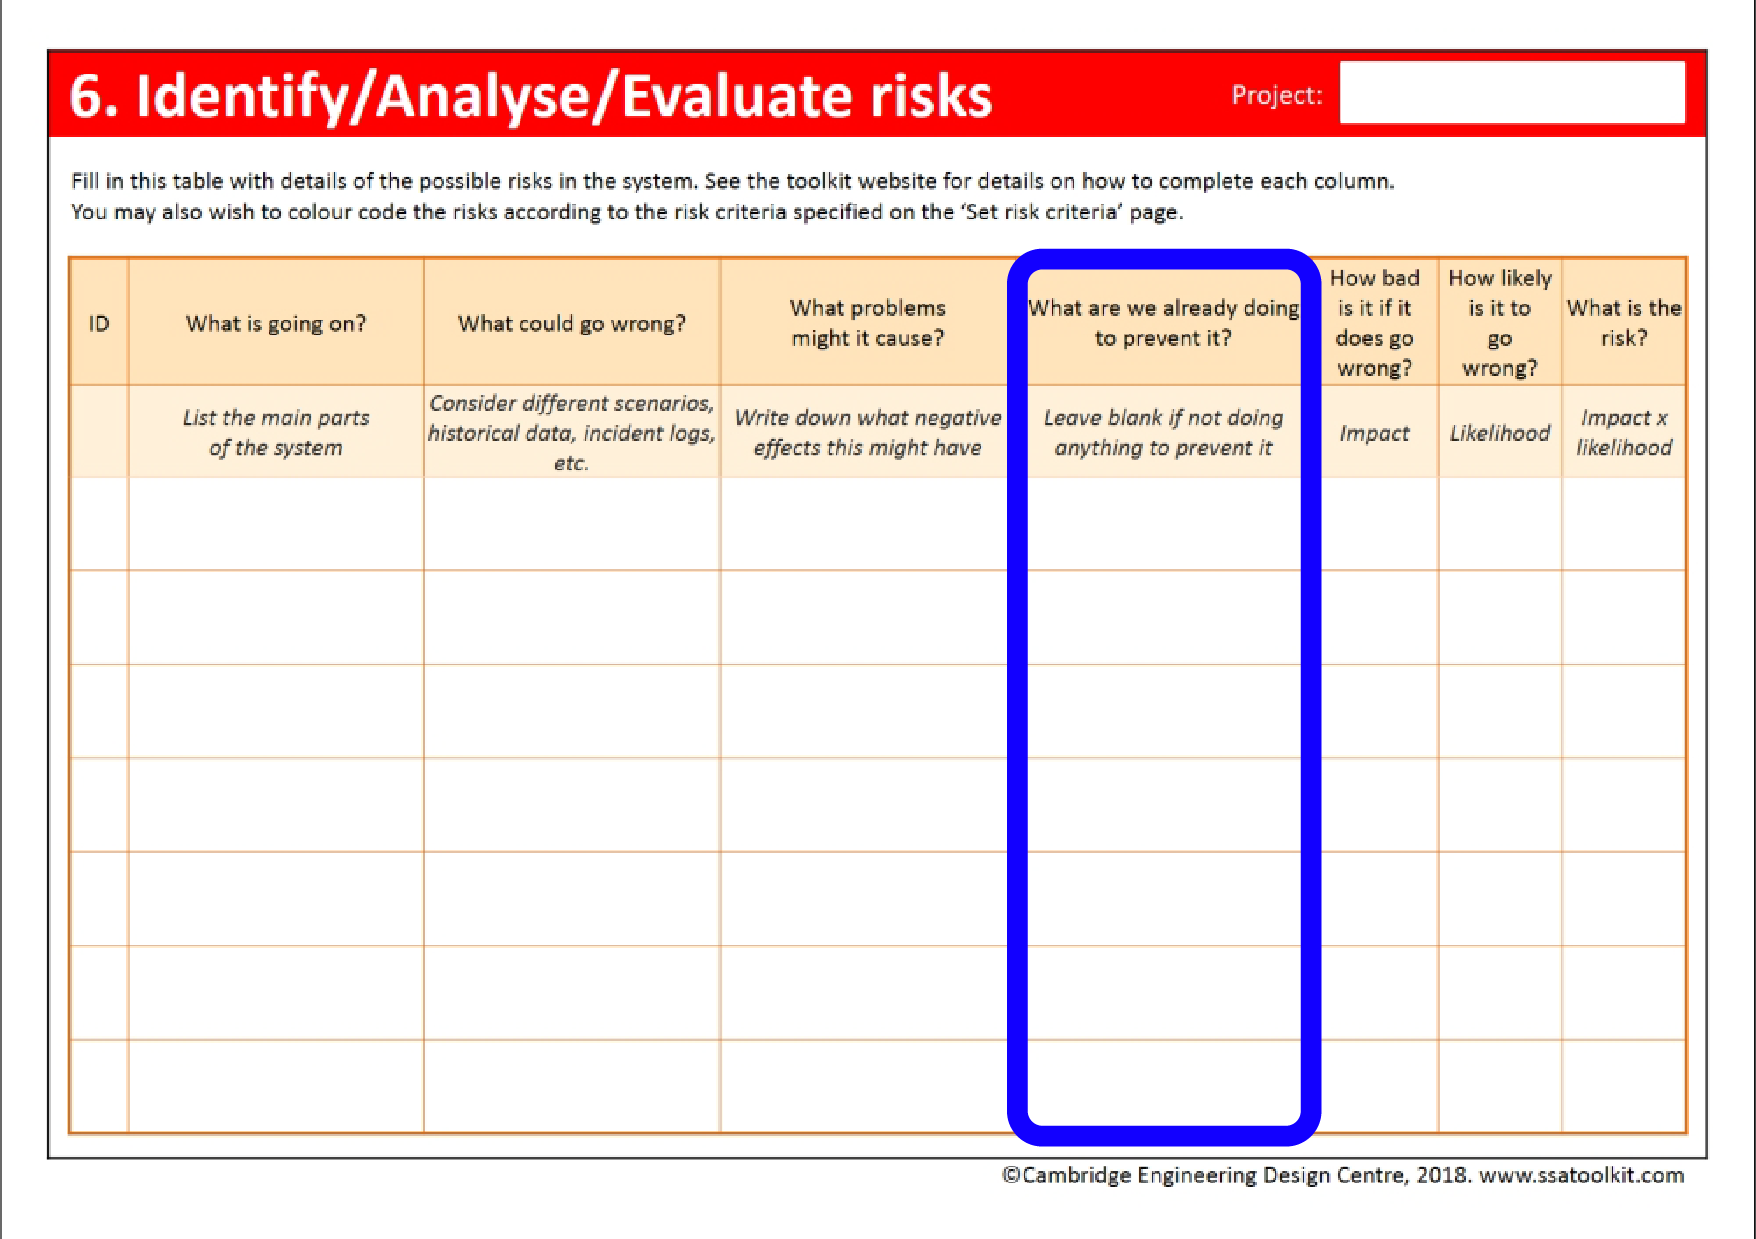
What are we doing to prevent it?
It is also important to record any measures already in place to prevent the problems from arising, or to reduce their impact or likelihood. These need to be taken into account in the SSA when rating impact, likelihood and risk. However, note that such measures are never perfect in reducing risk, either because they are not always adopted in daily practice (often for ‘good’ reasons), or because they are fundamentally imperfect in some way.
The existing measures will also affect the Propose actions activity later in the SSA. The proposed actions will benefit from information about the effectiveness of and flaws in the measures that are already in place.
Existing measures can take many forms, including administrative actions such as policies and procedures, activities performed by staff such as doing frequent patient observations, the use of medical devices to monitor patients, or staff training.
Putting ‘What are we already doing to prevent it’ into practice |
|
|---|---|
|
|
|
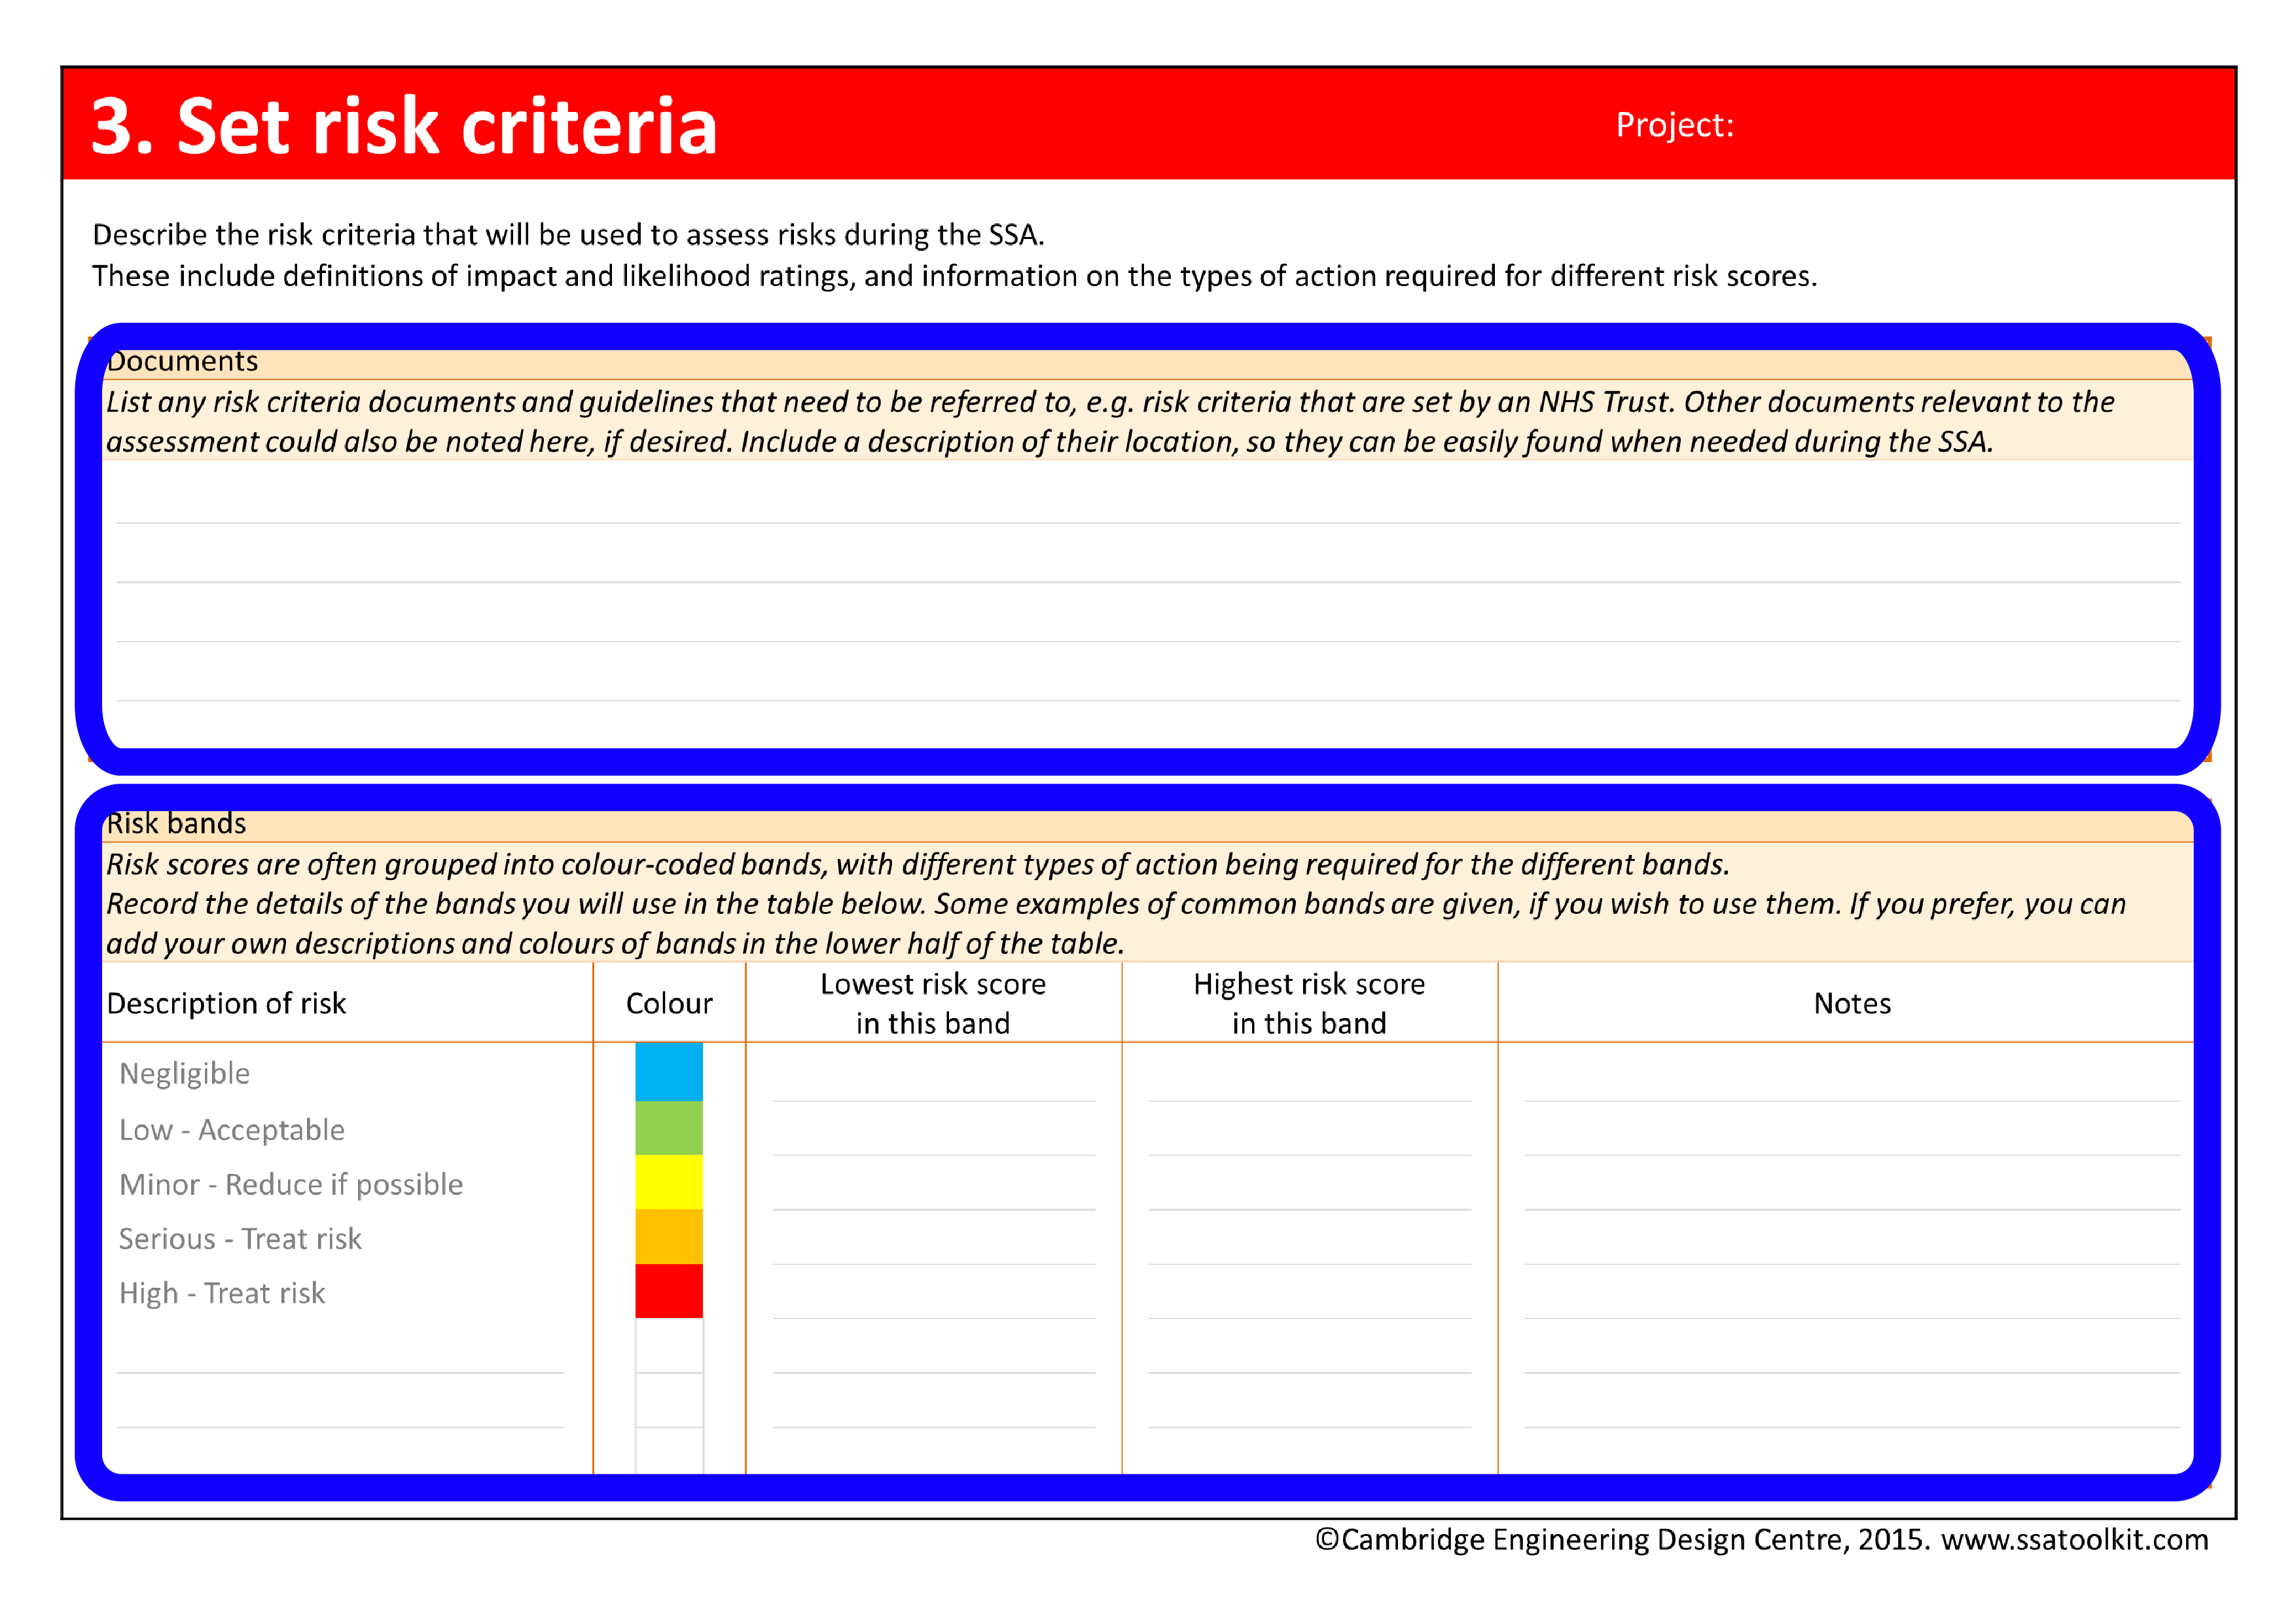
Retrieving risk criteria
At this point, it is important to retrieve the risk criteria that were established for the SSA during the Set risk criteria activity. These criteria include the definitions of impact and likelihood levels that will be used in estimating impact and likelihood for each of the potential problems in the system.
Putting ‘Retrieving risk criteria’ into practice |
|
|---|---|
|
|
|

Estimating impact
It is now necessary to estimate the impact of the outcomes. Impact refers to the severity or ‘consequence’ of the outcomes. The greater the impact, the more important it is to do something about it. For example, the severity of a mix up between two medicines depends upon the types of medicines involved: the intravascular injection of sterile saline solution may result in no harm, whereas the injection of Vincristine into the spine will result in the death of the patient. Here the latter clearly has greater impact.
Impact is rated by referring to the definitions of impact levels included in the risk criteria retrieved above. An example of a set of definitions is shown below. The definitions match impact ratings to detailed descriptions of harm. In the example below, an impact rating of 2 (low/minor) would be assigned to an issue that results in someone needing first aid.
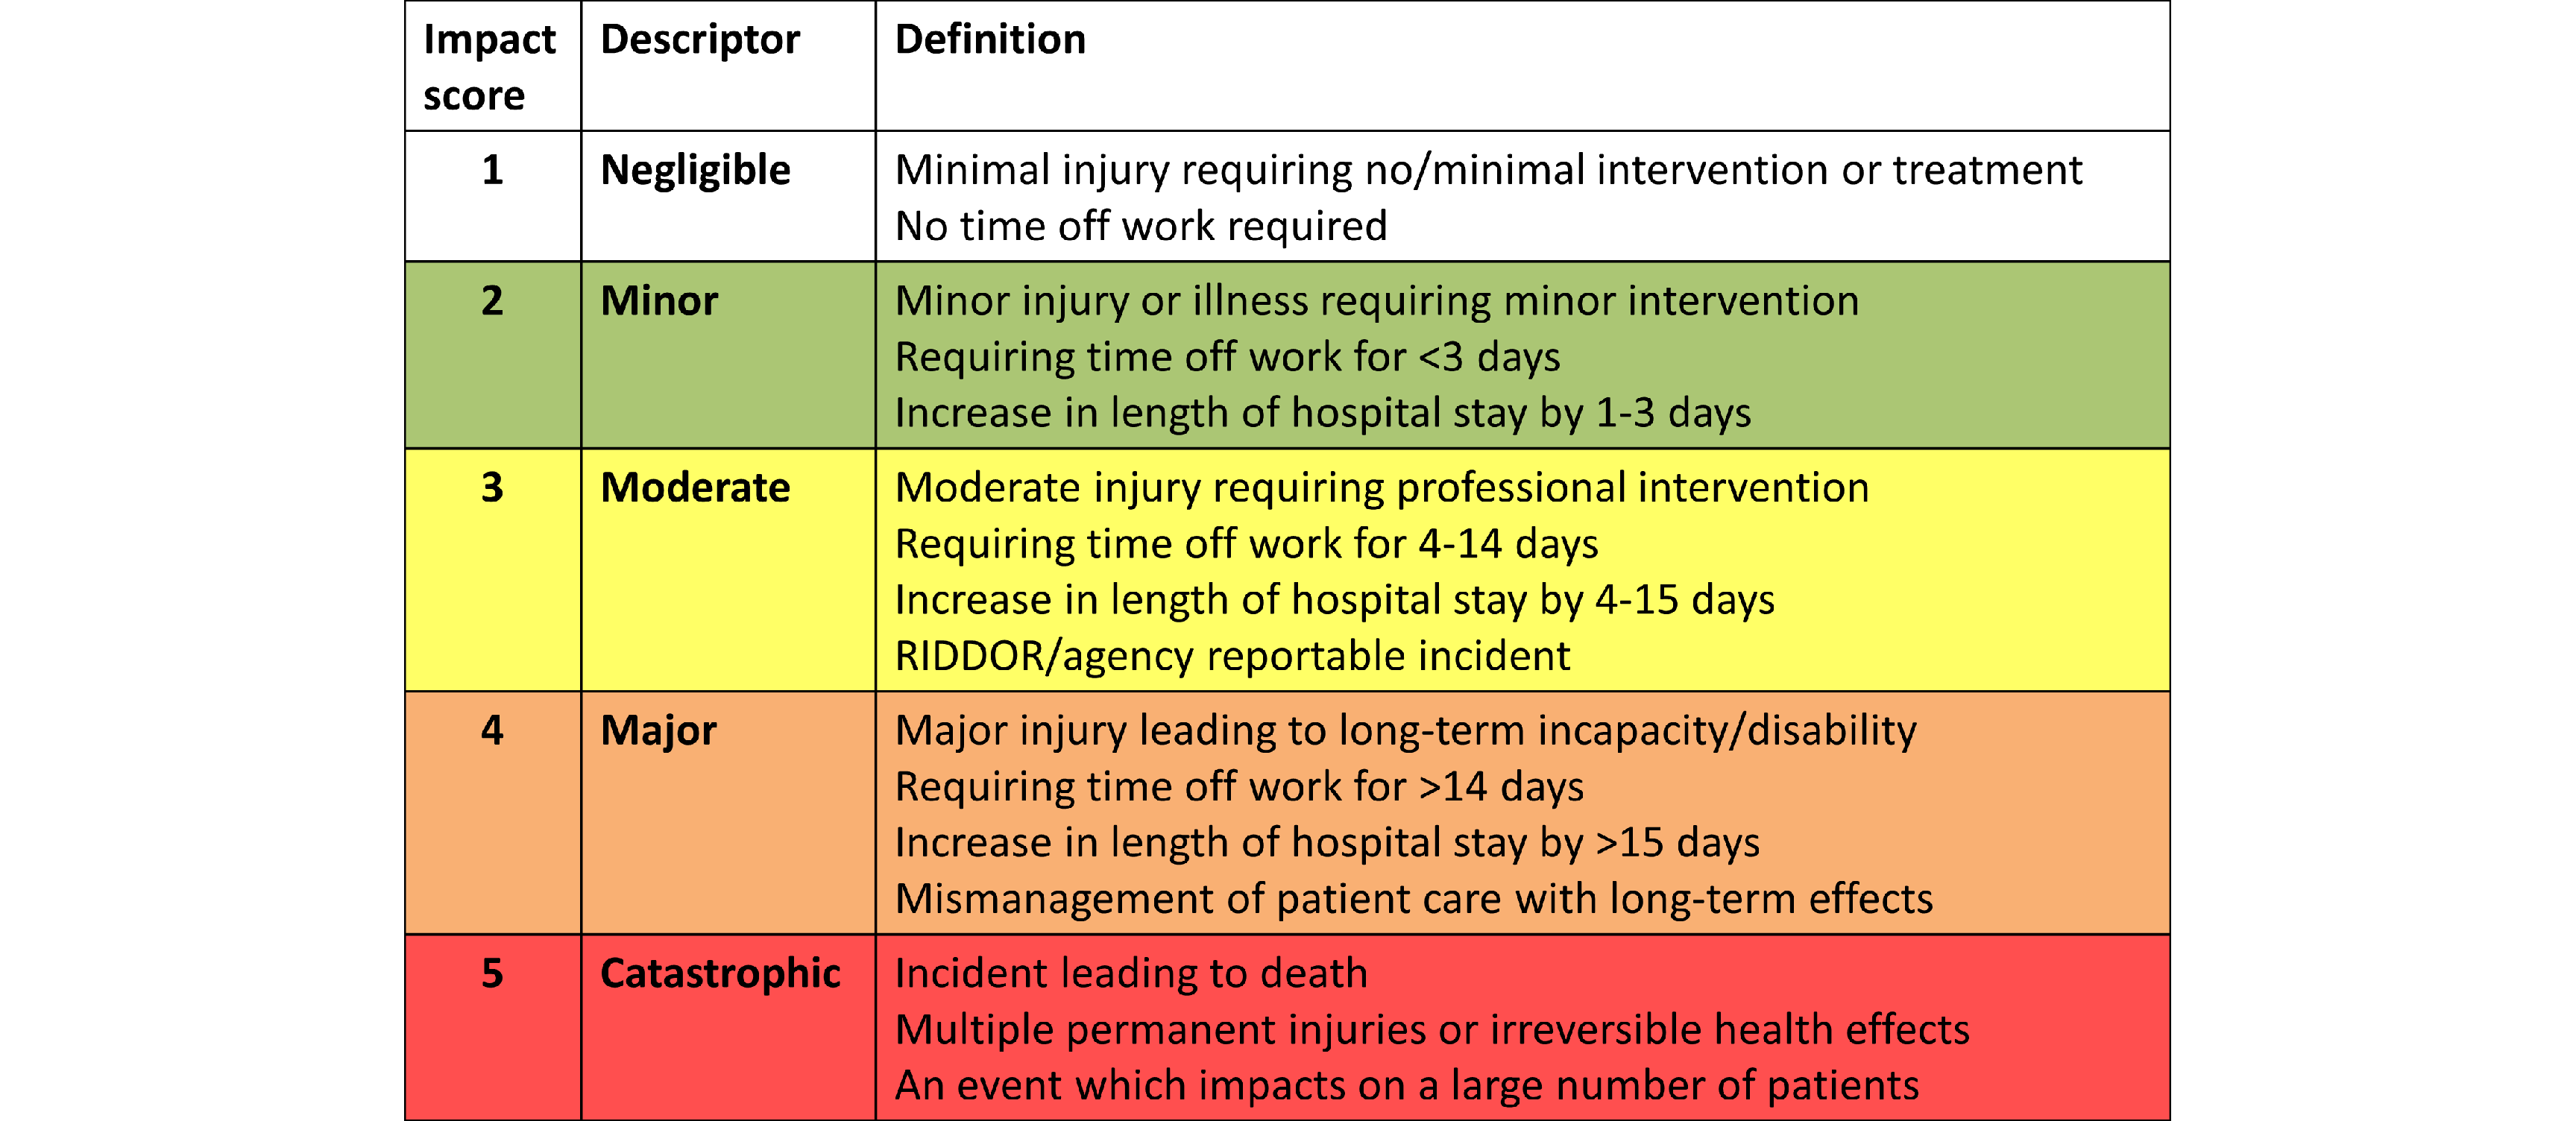
It may be helpful when determining the quantitative impact or rating of an event to:
- Examine the problems that might arise from the event, and consider their severity by comparison with available definitions of impact;
- Examine the impact that this event or similar events have had in the past, either in the current facility under examination or in other facilities;
- Consider whether any existing measures (identified above) affect the impact rating;
- Separate the ratings for different types of impact, for example, across more than one row in the assessment form, as shown below.
Putting ‘Estimating Impact’ into practice |
|
|---|---|
|
|
|
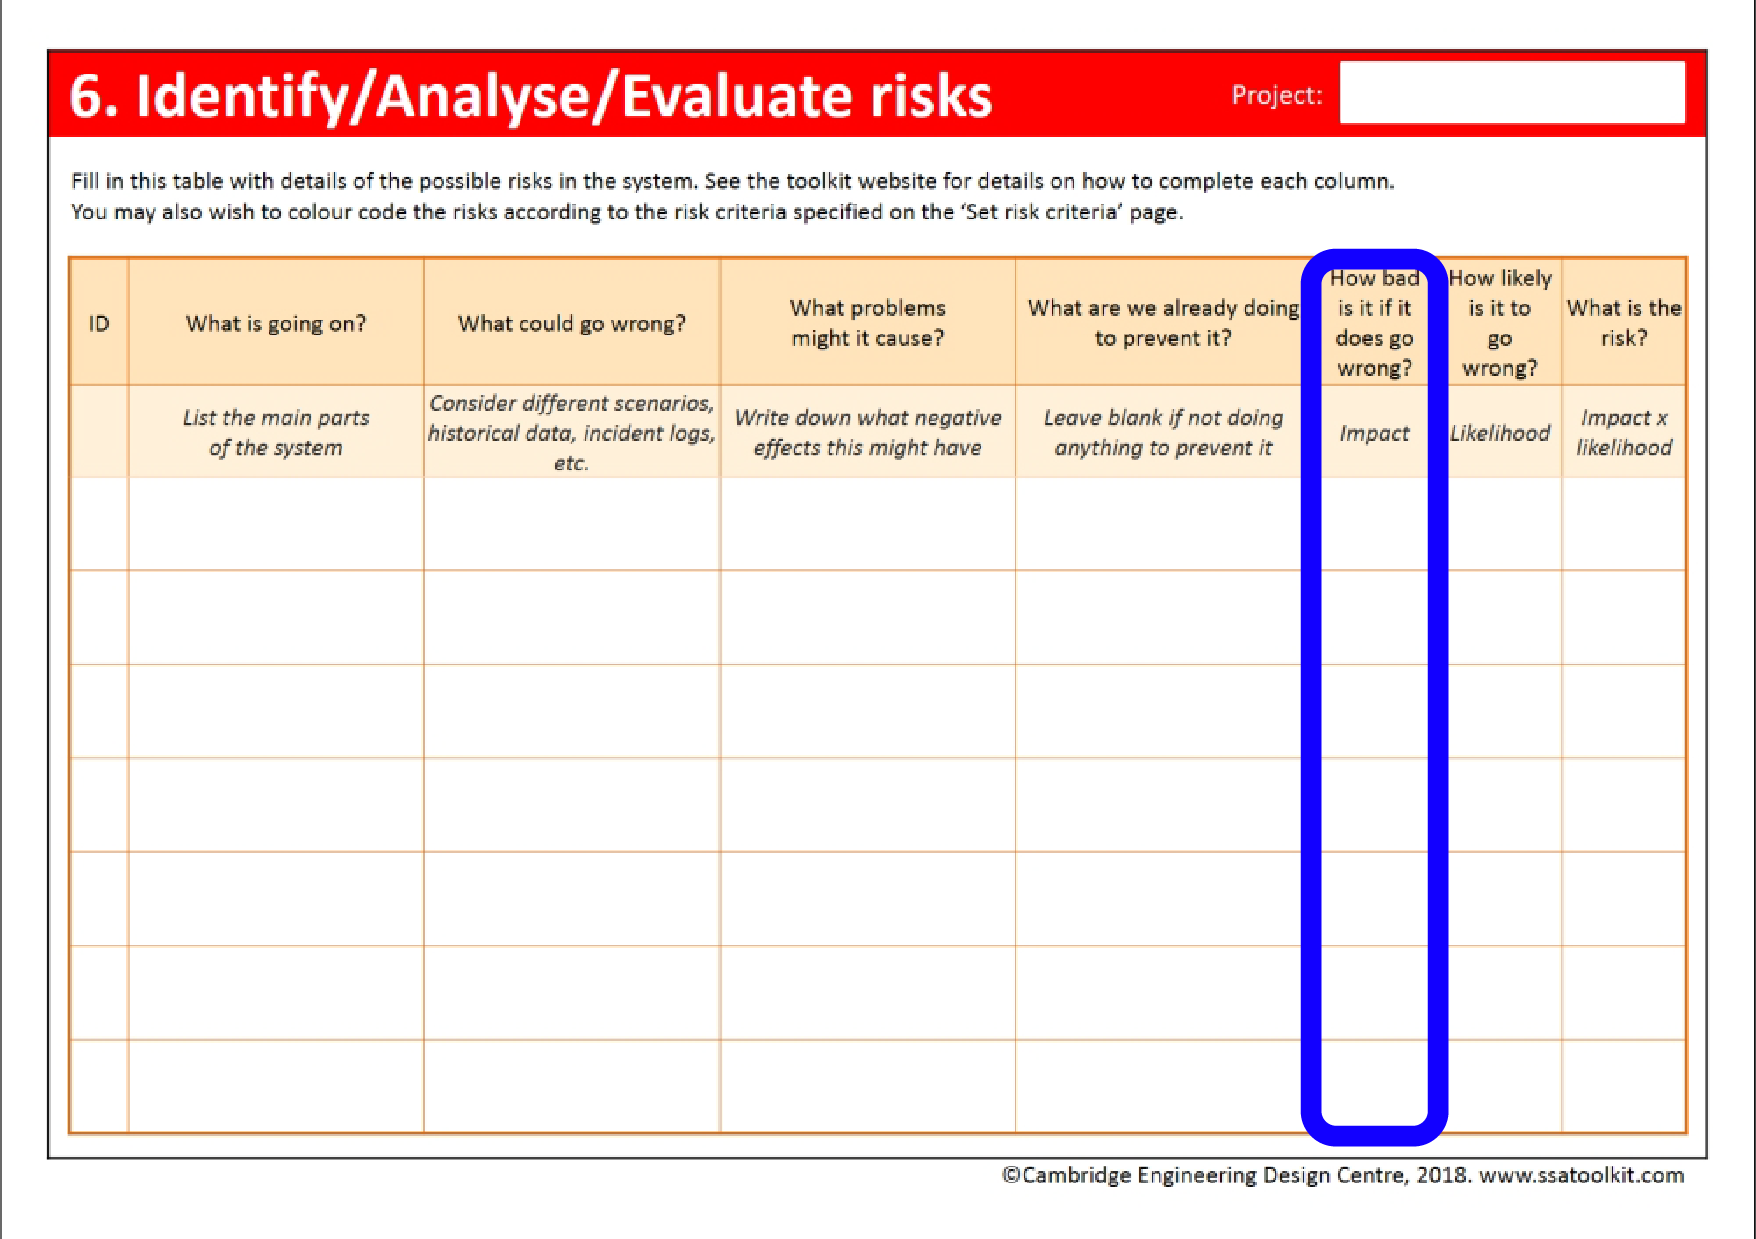
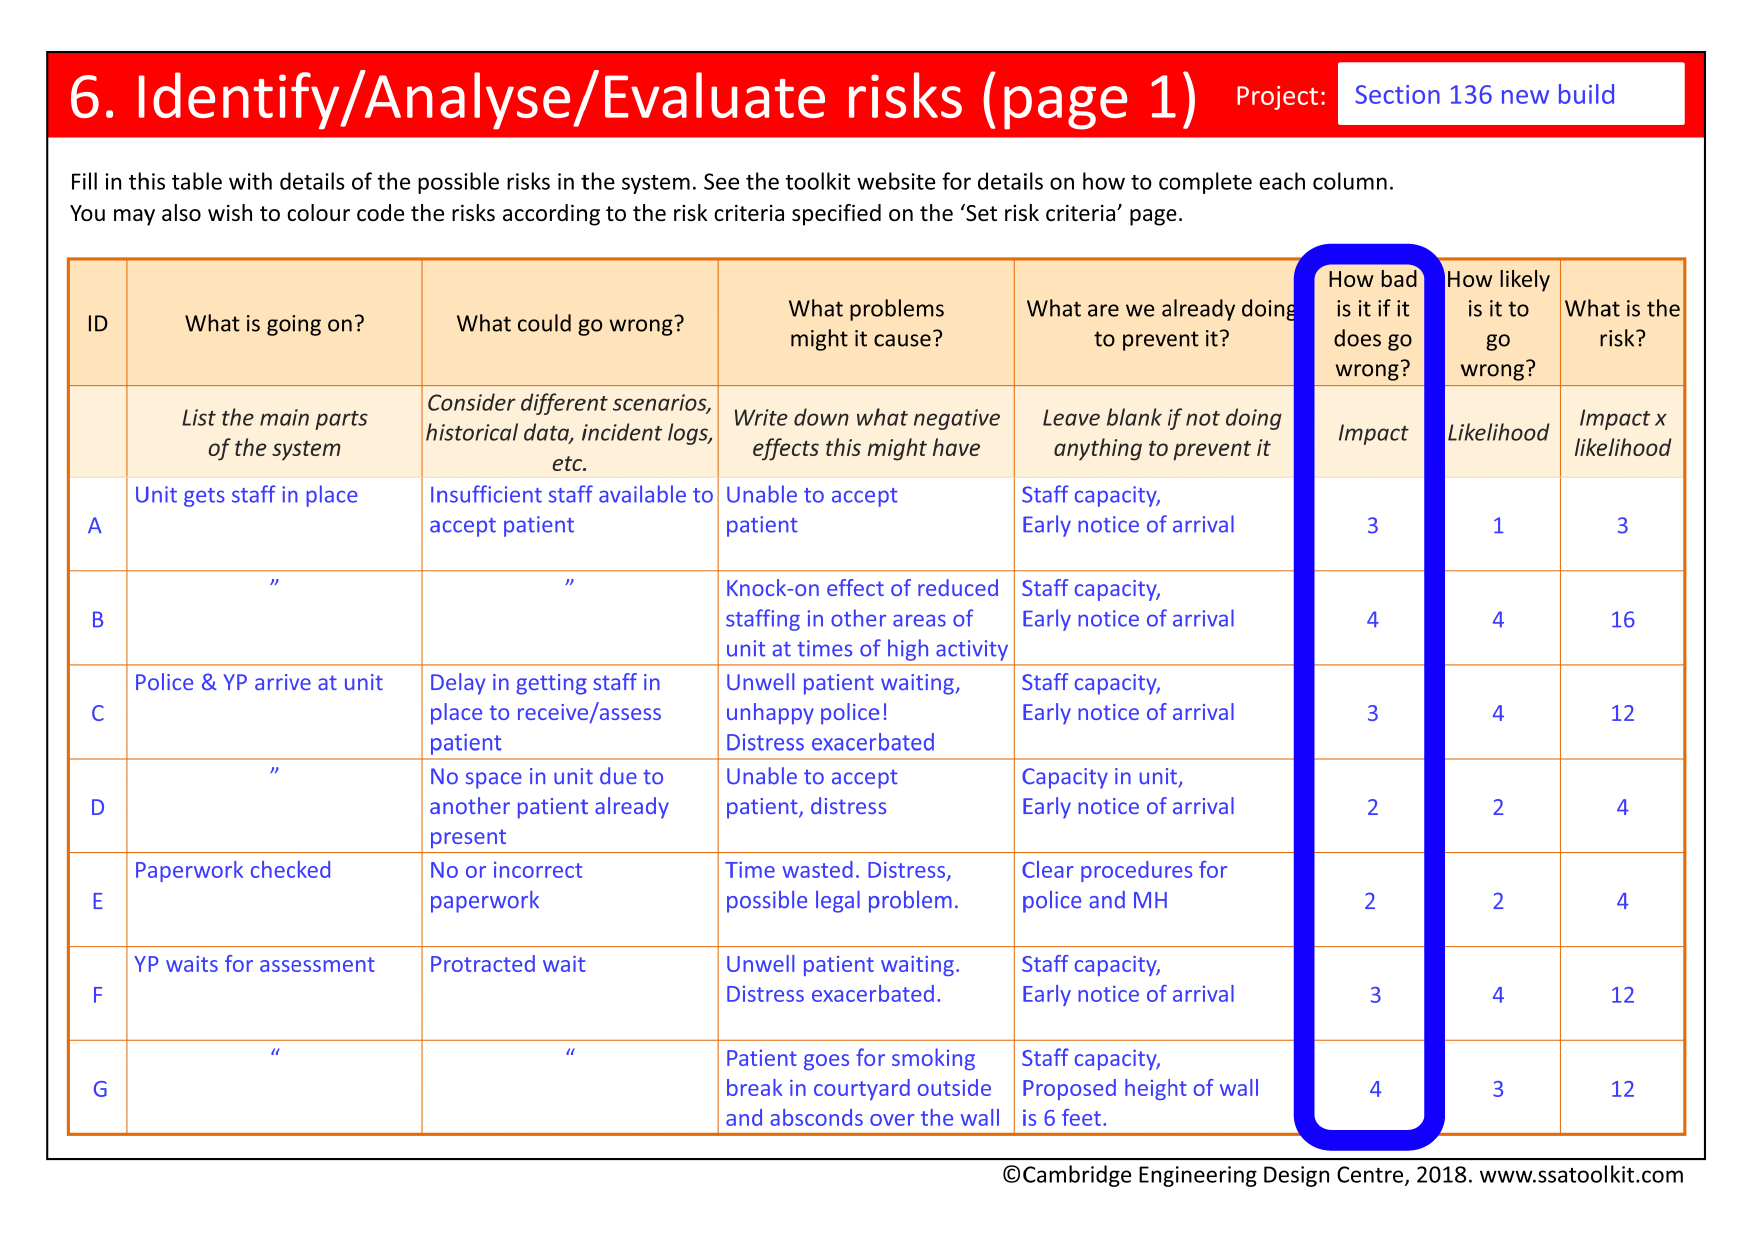
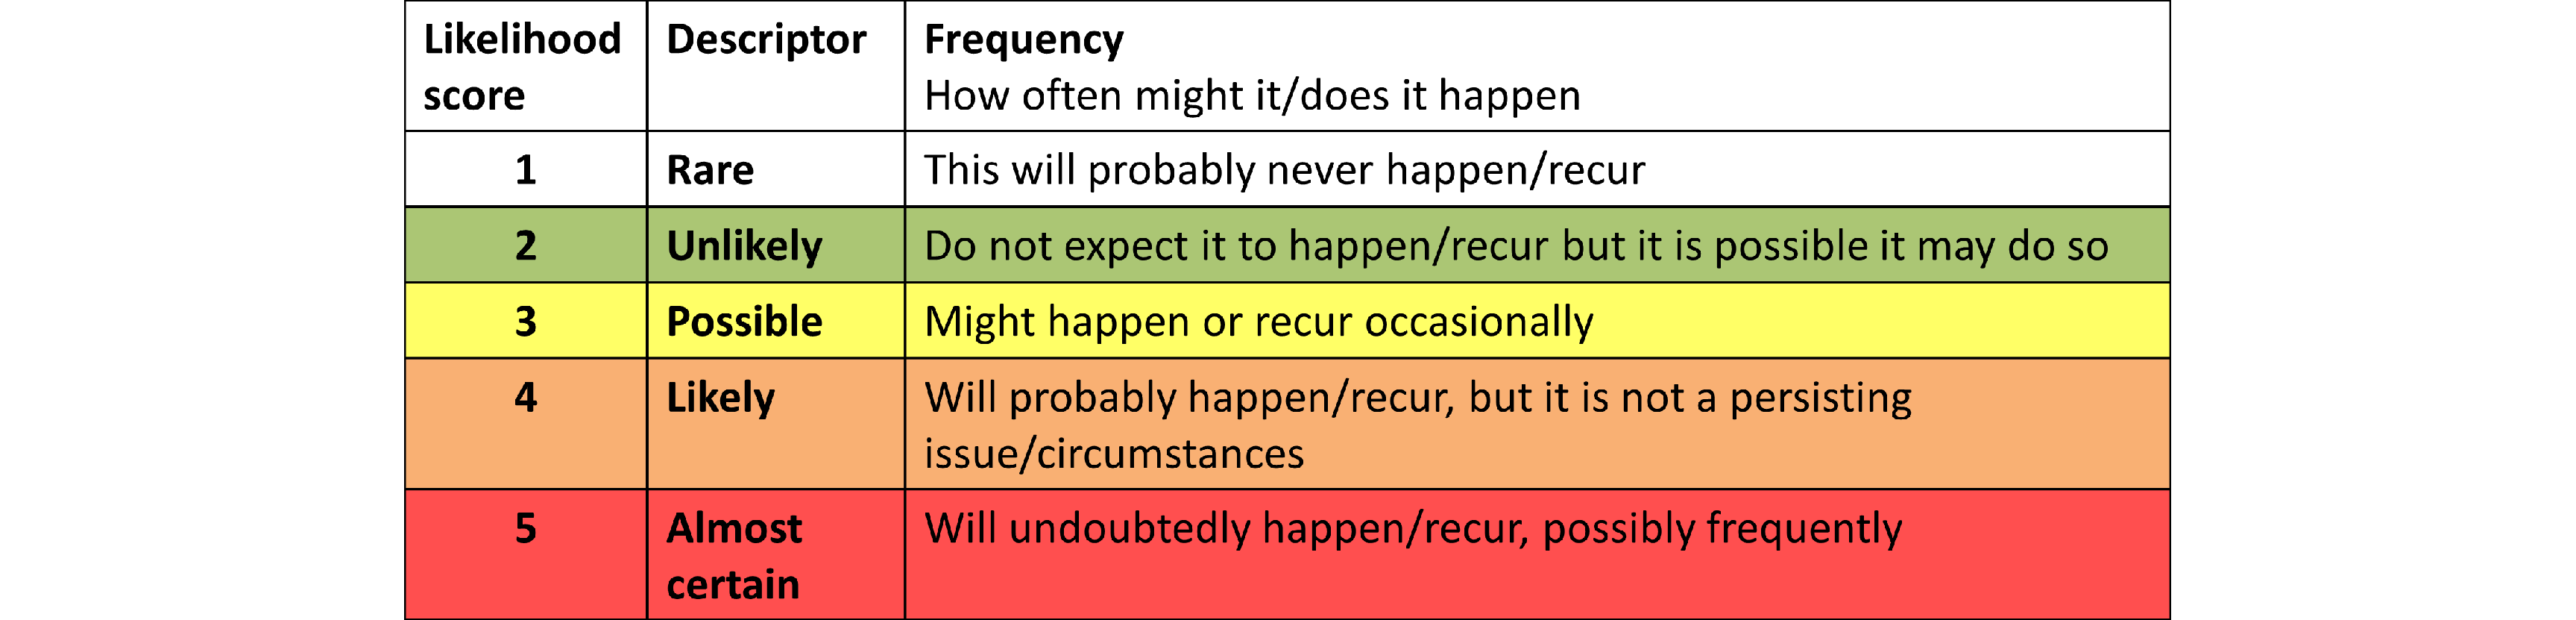
Estimating likelihood
It is also necessary to estimate the likelihood of the outcomes. Likelihood refers to how likely or probable it is that a potential problem will occur. This can vary from ‘rare’ to ‘almost certain’, through various levels of likelihood. The more likely a problem, the more important it may be to do something about it. For example, a mix up between two medicines needs to be taken more seriously if it is deemed likely to occur monthly, rather than once a decade.
Likelihood is rated by referring to the definitions of likelihood levels included in the risk criteria retrieved above. An example of a set of definitions is shown below. In this example, a rating of 3 would be given to an issue that ‘might happen occasionally’, where this requires some individual judgement, for example, to interpret what is meant by ‘occasionally’.
It may be helpful when determining the likelihood of an event to look at data for how often this event has happened in the past, either in the current facility under examination or in other facilities. If the system or the event is novel, then an idea of likelihood can still be attained by examining data for similar events, for example, mistakes in prescriptions for other medicines.
It is also important to consider any existing measures to control risk (identified above), and how they might moderate the likelihood of the event in practice. For example, a haematology unit may have a policy of using safety syringes, in theory reducing the chance of a needlestick injury to zero. However, if the policy is generally ignored, the chance of the injury will be higher.
The scenario in which the event takes place can also influence the likelihood rating. For example, the chance of a staff member receiving a needlestick injury from a patient with a communicable disease may depend greatly upon whether the SSA is considering treatment in a general ward, or a specialist haematology clinic. The likelihood may be still greater if assessing an emergency resuscitation scenario, where speed of treatment is essential and where the patient may be confused and agitated. This shows the importance of stating the assumptions and describing the scenario clearly in the Outline goals and Describe system activities in the Examine phase.
Rating the likelihood of an event may provoke some discussion and disagreement over the exact score. Generally this is a healthy sign that the participants are engaging with the process, but it can be a sign that the scope of the assessment is too broad and may require some restriction. For example, when staff from different units with different exposures to risk are taking part in the same SSA, it can be helpful to split into different groups and run more than one assessment, noting where the variation occurs and by how much. An alternative and simpler strategy may be to just use the highest, worst case, score.
Putting ‘Estimating likelihood’ into practice |
|
|---|---|
|
|
|
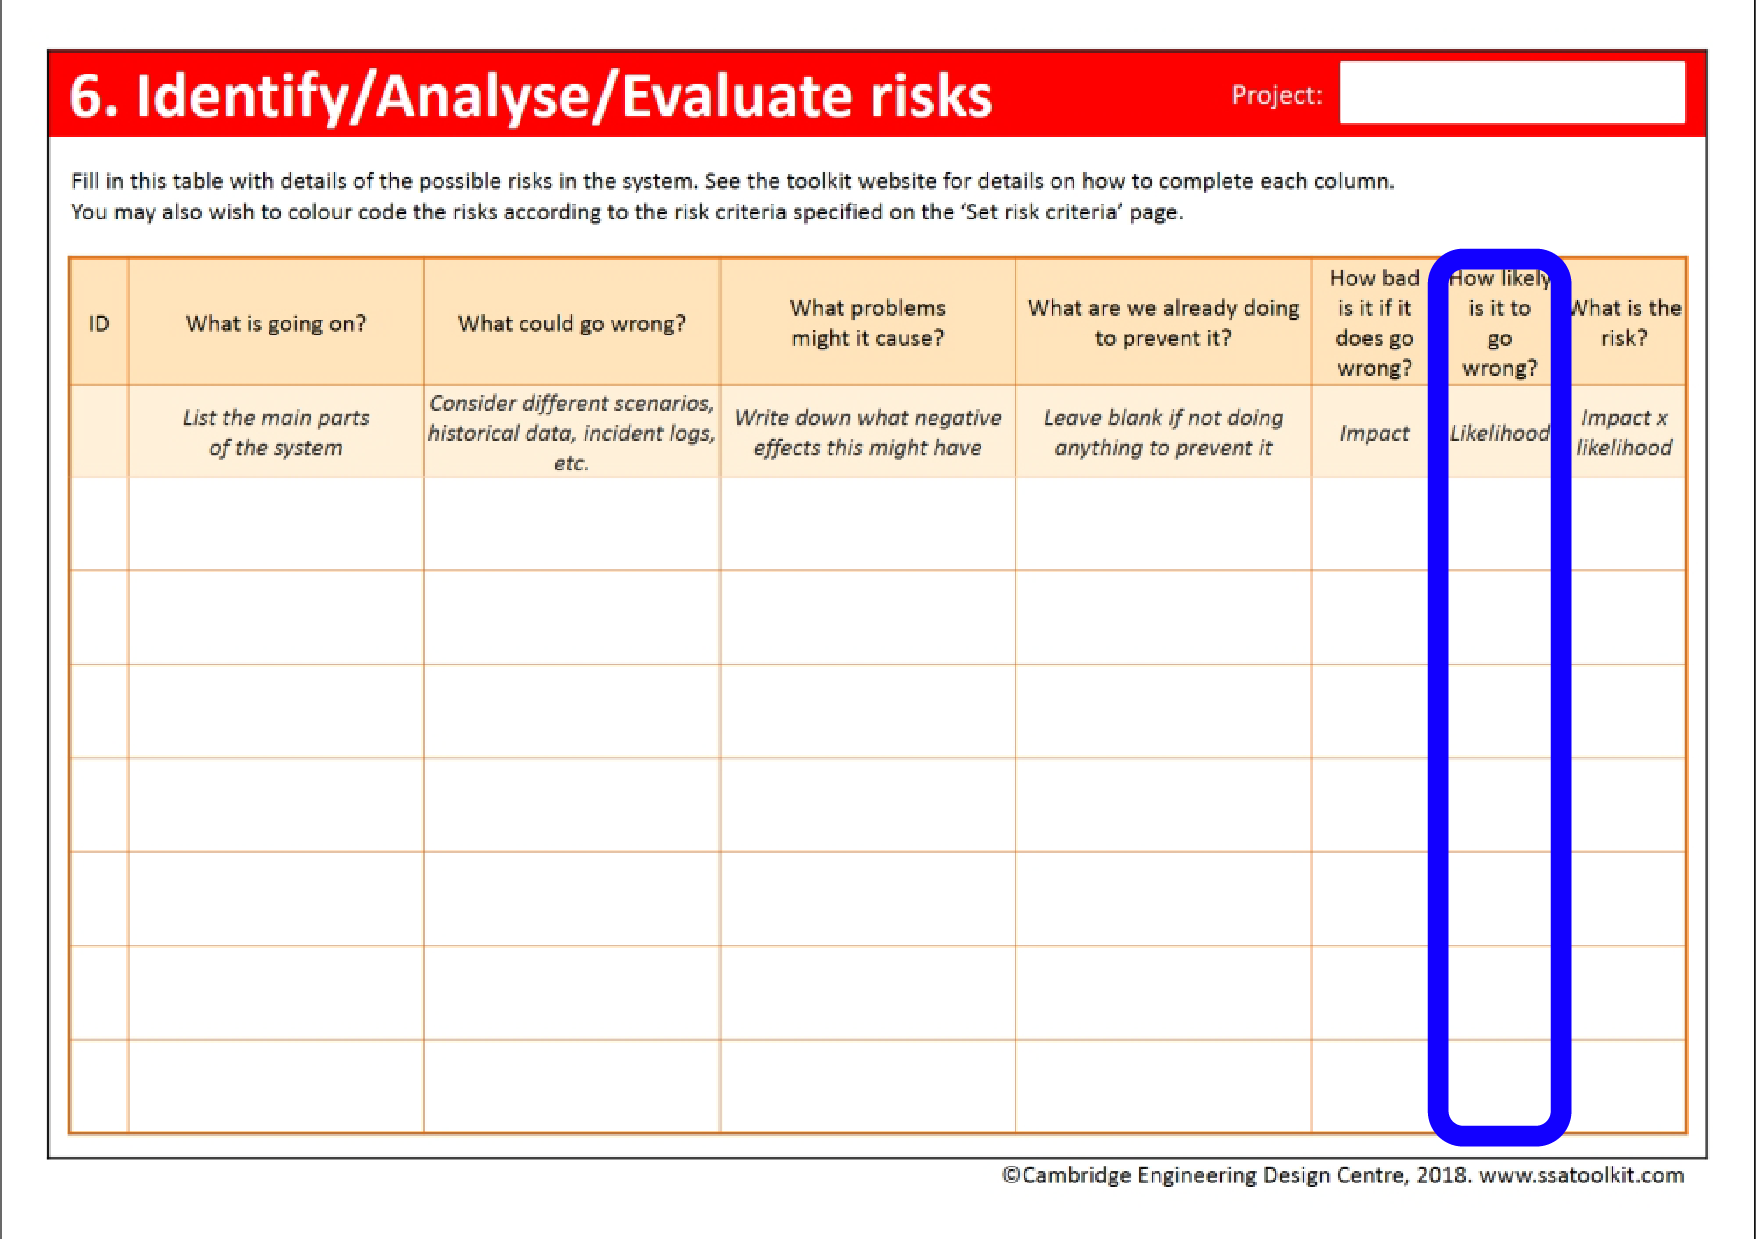
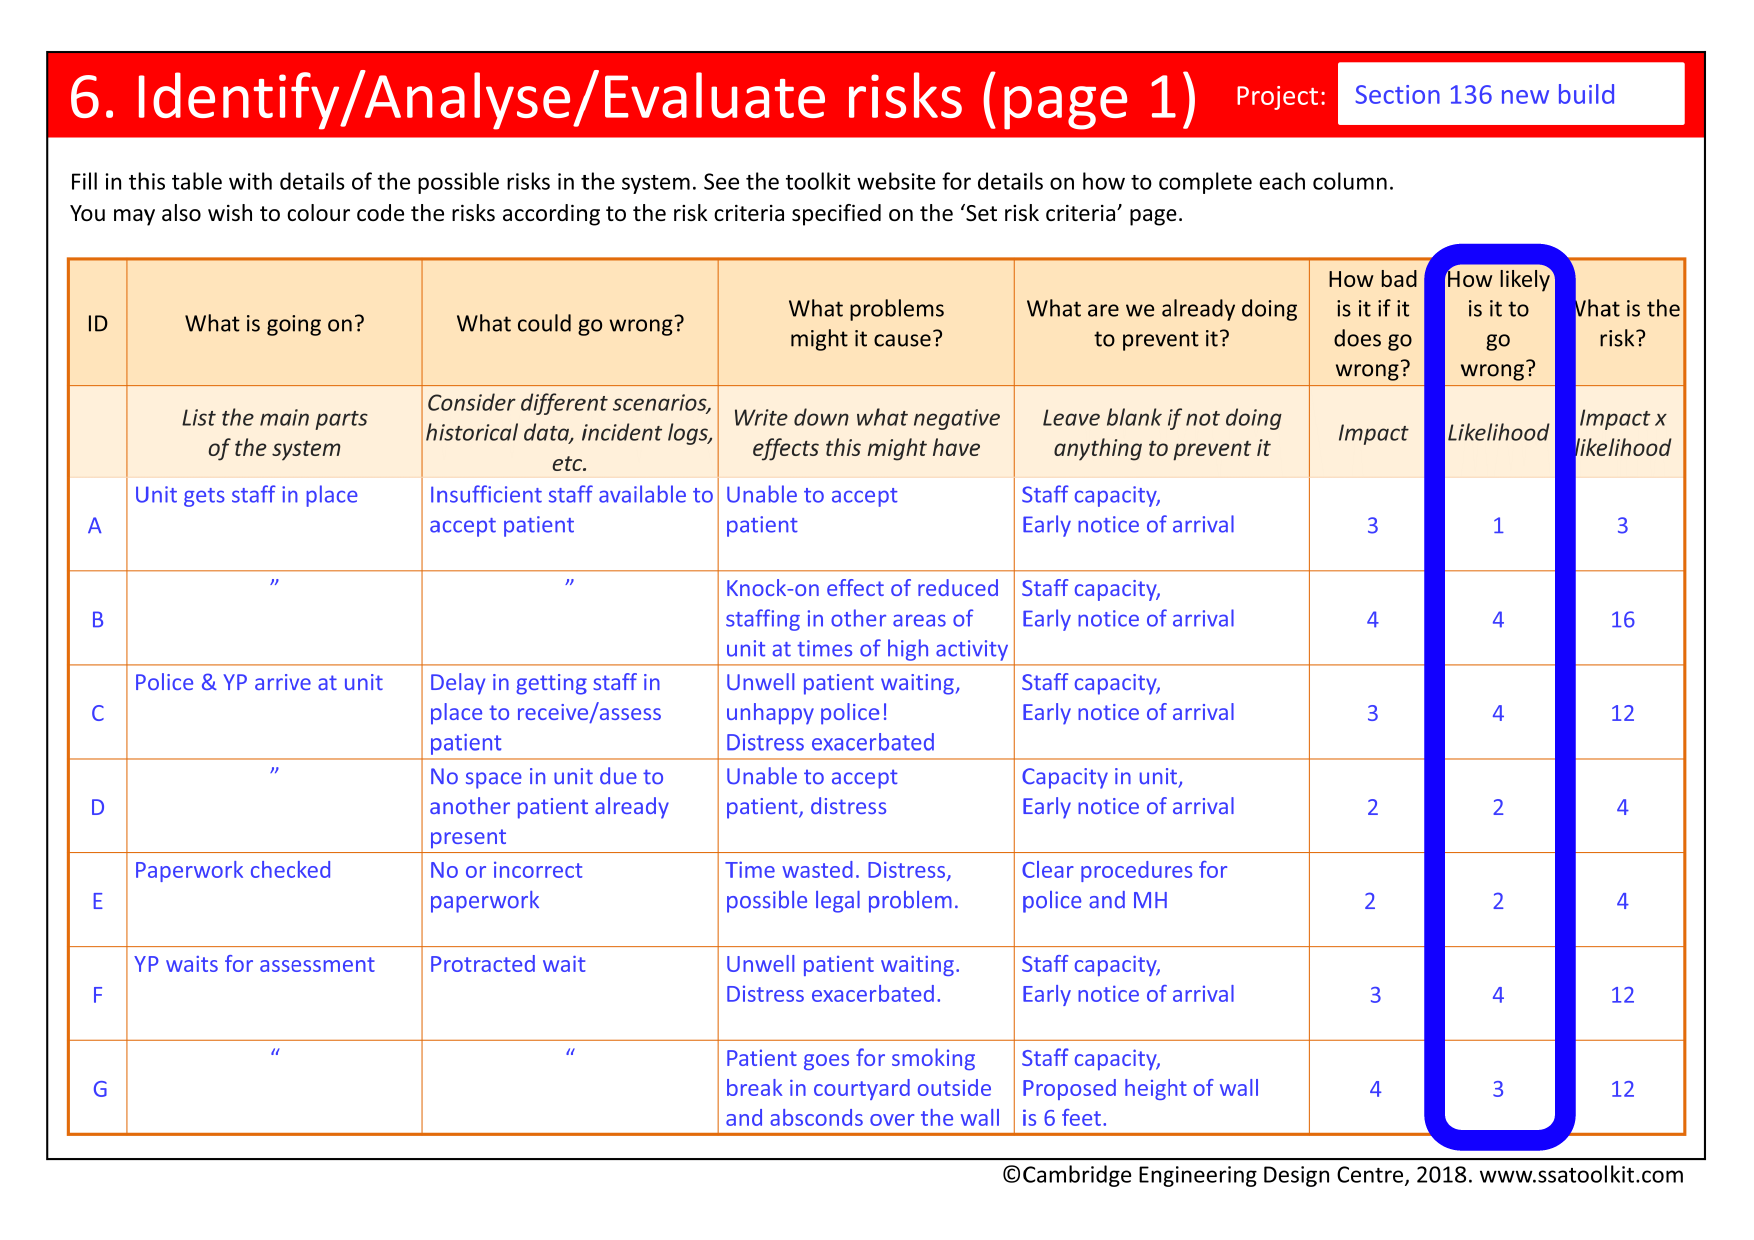
Calculating risk
Once impact and likelihood have been estimated, it is useful to calculate a risk score for each event by multiplying these two values together. For example, an incident may have an impact of 3 and a likelihood of 4. Its risk is then 3 multiplied by 4, i.e. 12.

Examples of risk calculations
Putting ‘Calculating risk’ into practice |
|
|---|---|
|
|
|